
Probability Tree Diagrams: Step-by-Step
This quick introduction will teach you how to calculate probabilities using tree diagrams.
Figuring out probabilities in math can be confusing, especially since there are many rules and procedures involved. Luckily, there is a visual tool called a probability tree diagram that you can use to organize your thinking and make calculating probabilities much easier.
At first glance, a probability tree diagram may seem complicated, but this page will teach you how to read a tree diagram and how to use them to calculate probabilities in a simple way. Follow along step-by-step and you will soon become a master of reading and creating probability tree diagrams.
What is a Probability Tree Diagram?
Example 01: Probability of Tossing a Coin Once
Let’s start with a common probability event: flipping a coin that has heads on one side and tails on the other:
This simple probability tree diagram has two branches: one for each possible outcome heads or tails. Notice that the outcome is located at the endpoint of a branch (this is where a tree diagram ends).
Also, notice that the probability of each outcome occurring is written as a decimal or a fraction on each branch. In this case, the probability for either outcome (flipping a coin and getting heads or tails) is fifty-fifty, which is 0.5 or 1/2.
Example 02: Probability of Tossing a Coin Twice
Now, let’s look at a probability tree diagram for flipping a coin twice!
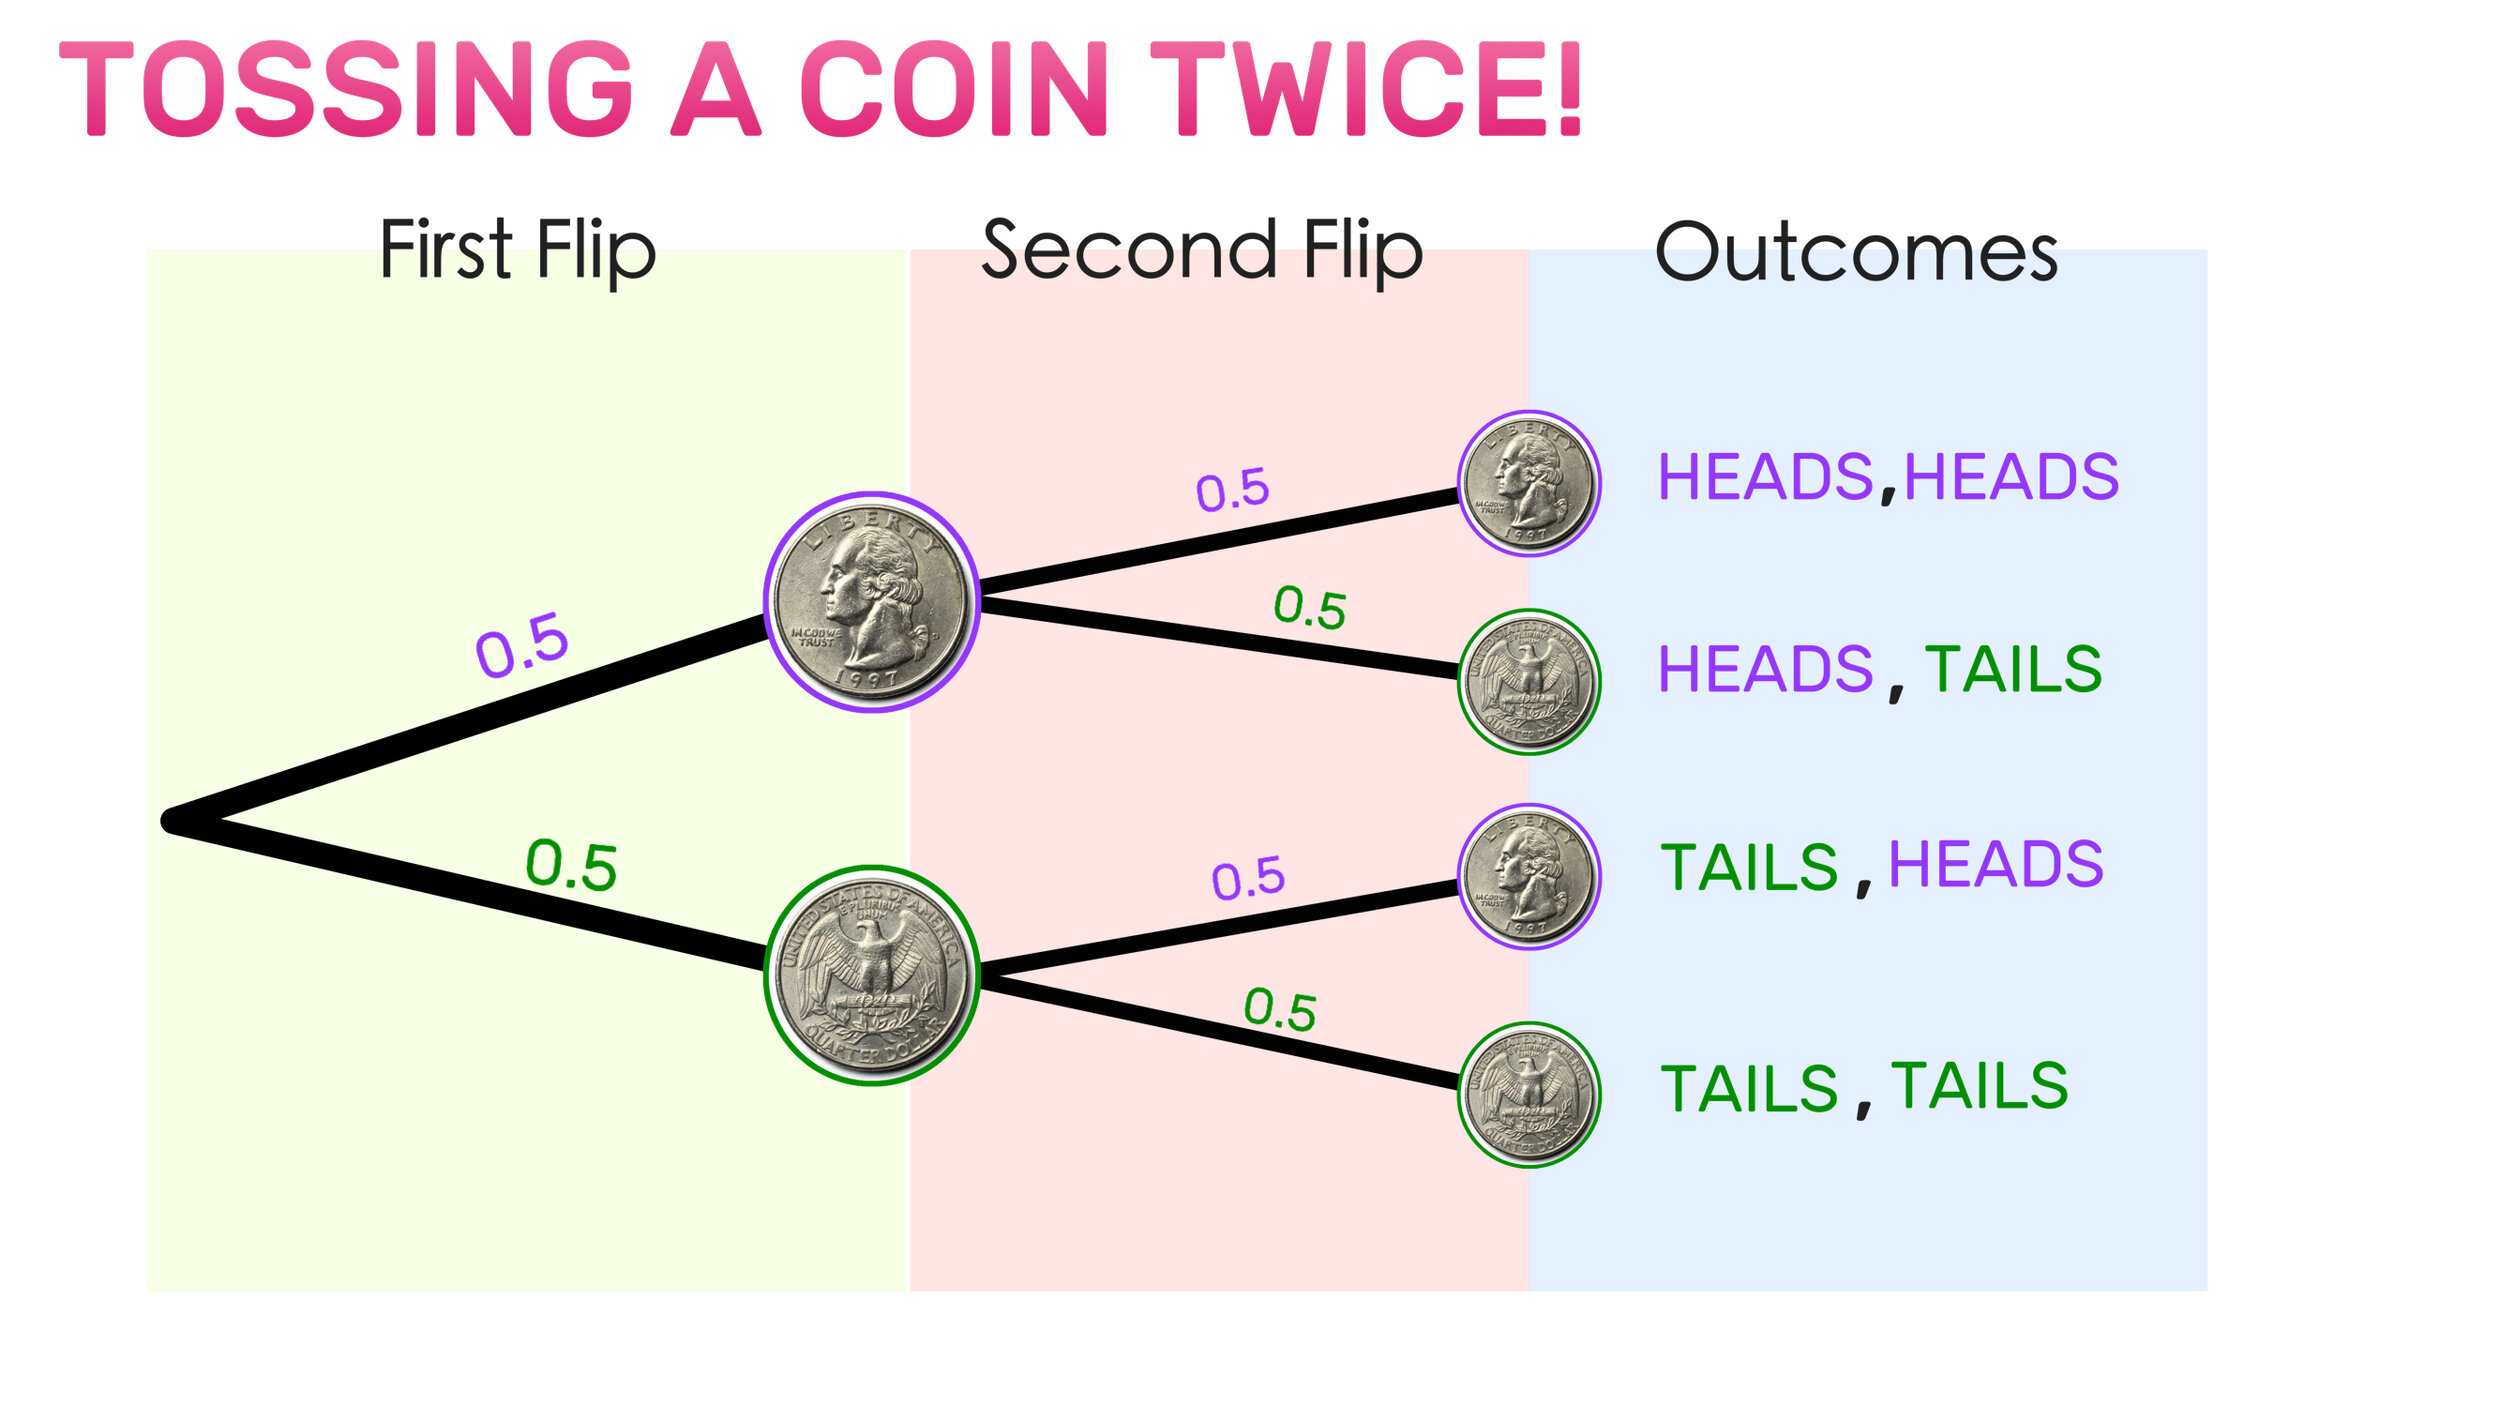
Notice that this tree diagram is portraying two consecutive events (the first flip and the second flip), so there is a second set of branches.
Using the tree diagram, you can see that there are four possible outcomes when flipping a coin twice: Heads/Heads, Heads/Tails, Tails/Heads, Tails/Tails.
And since there are four possible outcomes, there is a 0.25 (or ¼) probability of each outcome occurring. So, for example, there is a 0.25 probability of getting heads twice in a row.
How to Find Probability
The rule for finding the probability of a particular event in a probability tree diagram occurring is to multiply the probabilities of the corresponding branches.
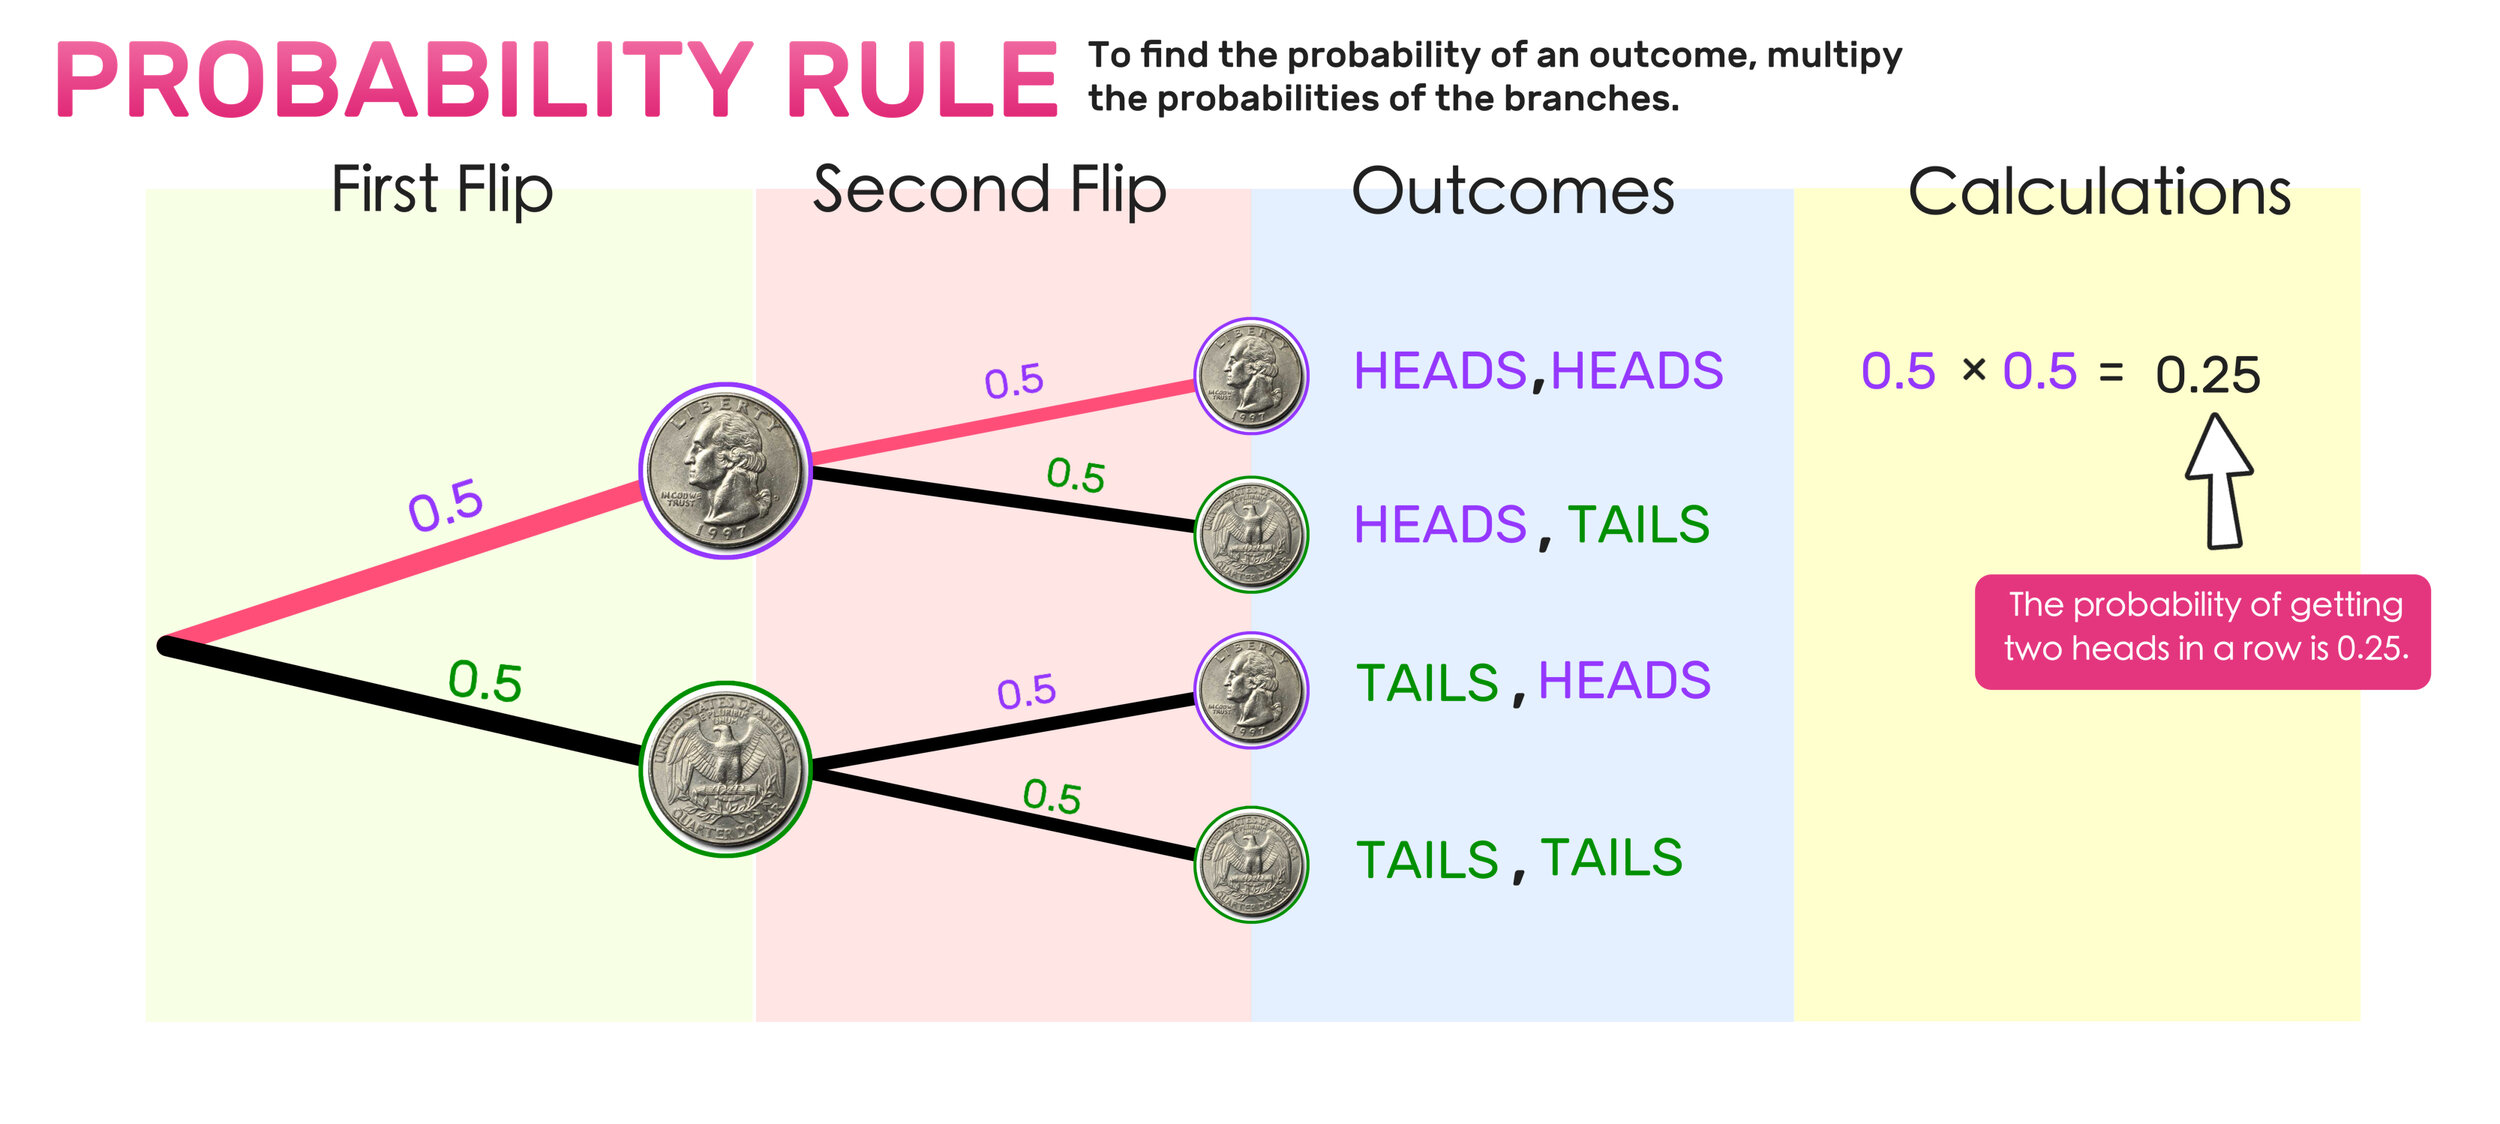
For example, to prove that there is 0.25 probability of getting two heads in a row, you would multiply 0.5 x 0.5 (since the probability of getting a heads on the first flip is 0.5 and the probability of getting heads on the second flip is also 0.5).
0.5 x 0.5 = 0.25
Repeat this process on the other three outcomes as follows, and then add all of the outcome probabilities together as follows:
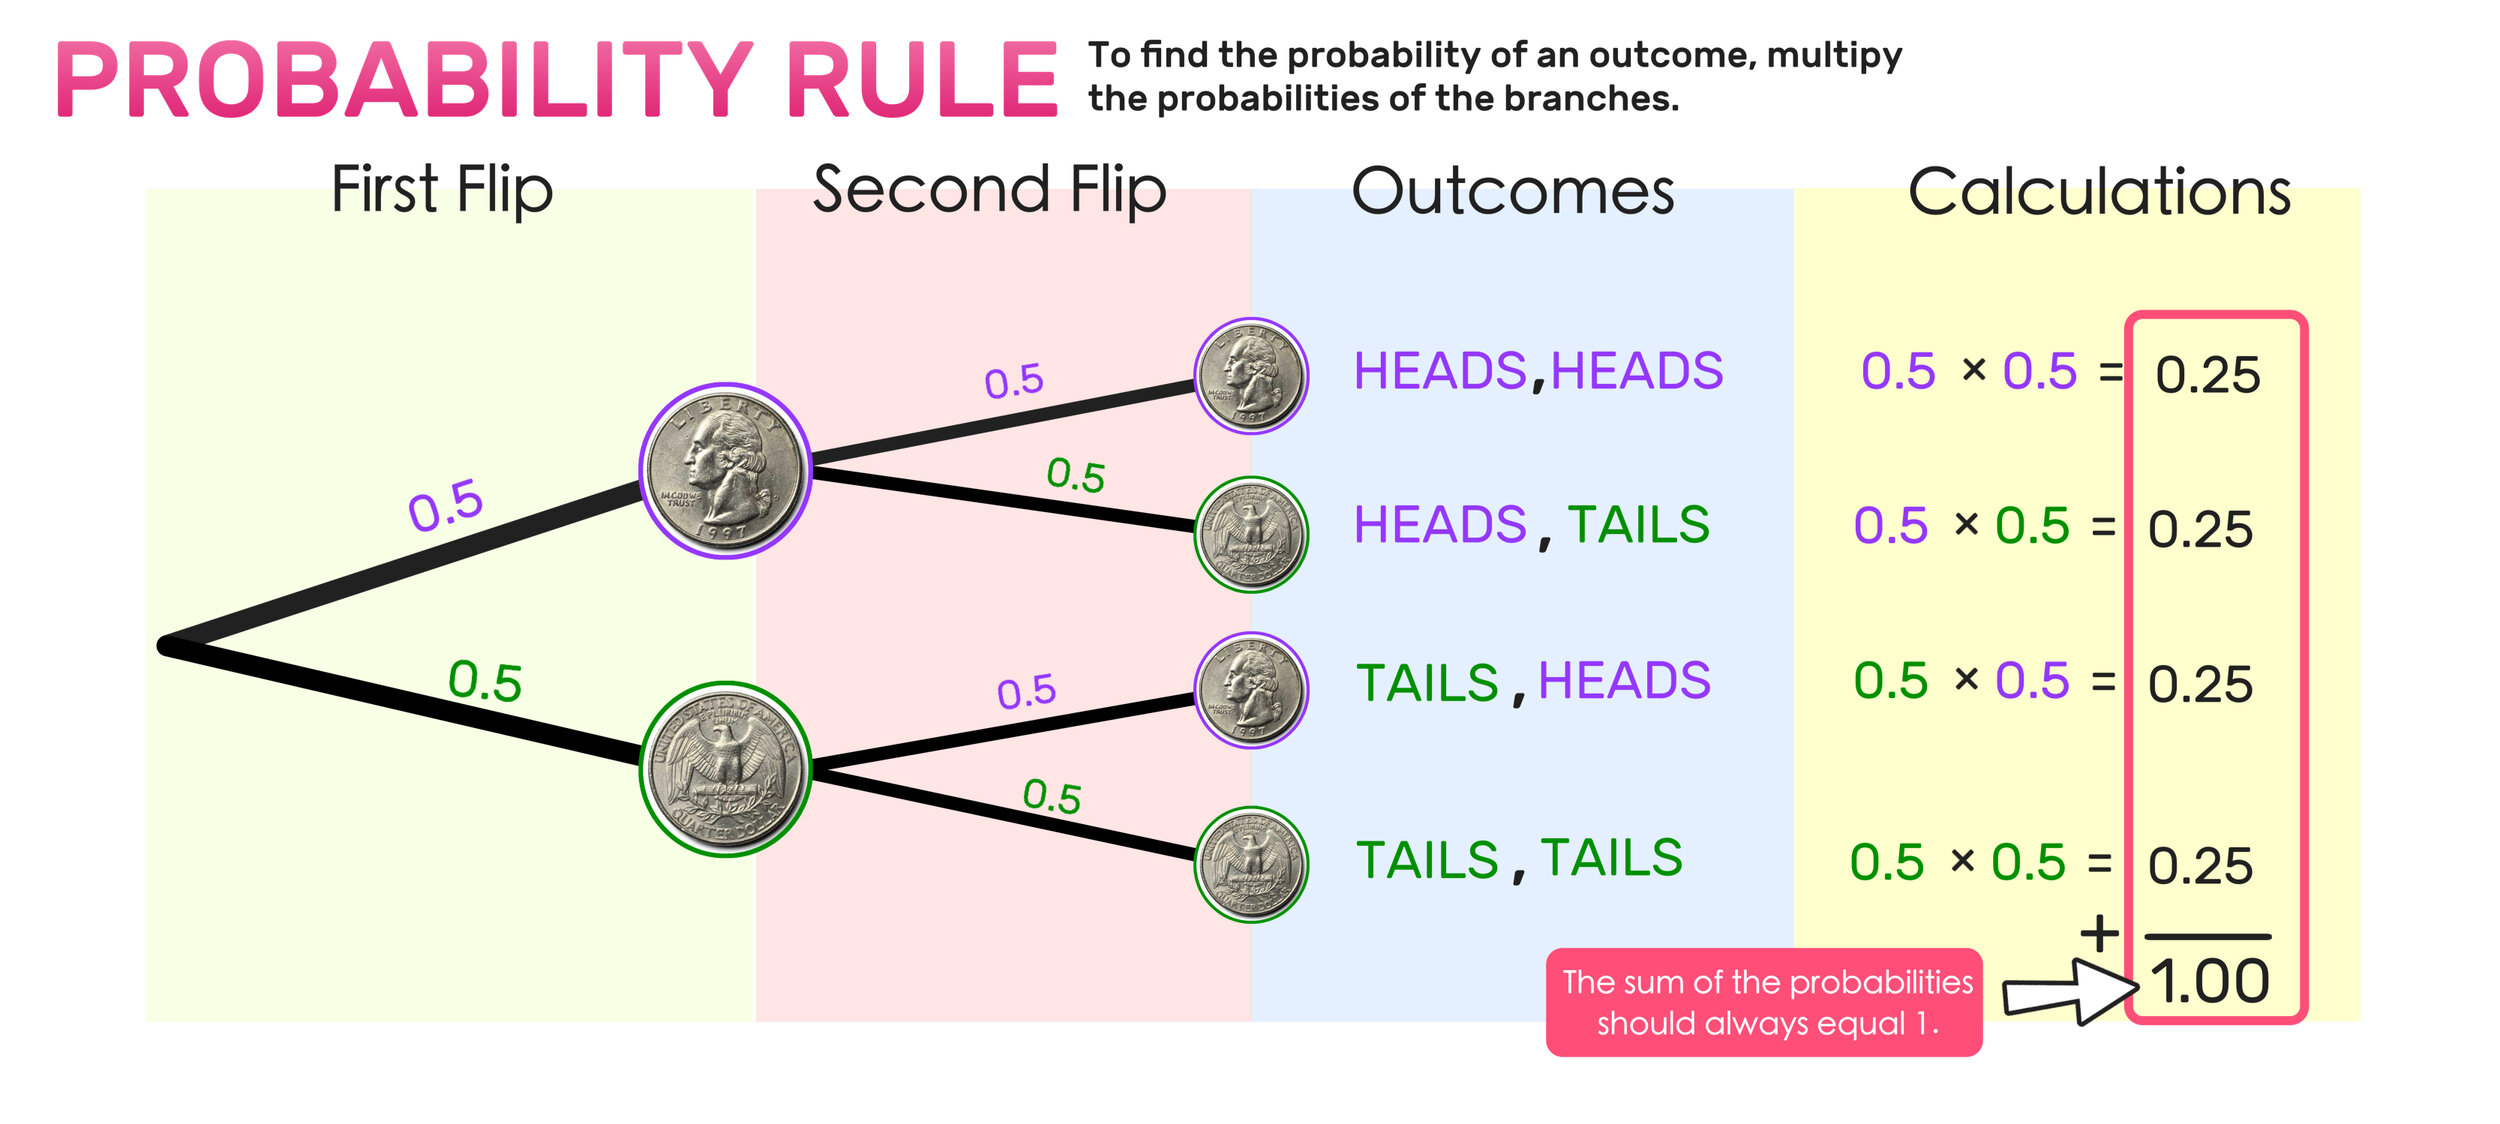
Note that the sum of the probabilities of all outcomes should always equal one.
From this point, you can use your probability tree diagram to draw several conclusions such as:
· The probability of getting heads first and tails second is 0.5x0.5 = 0.25
· The probability of getting at least one tails from two consecutive flips is 0.25 + 0.25 + 0.25 = 0.75
· The probability of getting both a heads and a tails is 0.25 + 0.25 = 0.5
Independent Events and Dependent Events
What is an independent event?
Notice that, in the coin toss tree diagram example, the outcome of each coin flip is independent of the outcome of the previous toss. That means that the outcome of the first toss had no effect on the probability of the outcome of the second toss. This situation is known as an independent event.
What is a dependent event?
Unlike an independent event, a dependent event is an outcome that depends on the event that happened before it. These kinds of situations are a bit trickier when it comes to calculating probability, but you can still use a probability tree diagram to help you.
Let’s take a look at an example of how you can use a tree diagram to calculate probabilities when dependent events are involved.

Looking for a fun hands-on activity for exploring probability in math?

Image Source: Mashup Math MJ
How to Make a Tree Diagram
Example 03:
Greg is a baseball pitcher who throws two kinds of pitches, a fastball, and a knuckleball. The probability of throwing a strike is different for each pitch:
· The probability of throwing a fastball for a strike is 0.6
· The probability of throwing a knuckleball for a strike 0.2
Greg throws fastballs more frequently than he throws knuckleballs. On average, for every 10 pitches he throws, 7 of them are fastballs (0.7 probability) and 3 of them are knuckleballs (0.3 probability).
So, what is the probability that the pitcher will throw a strike on any given pitch?
To find the probability that Greg will throw a strike, start by drawing a tree diagram that shows the probability that he will throw a fastball or a knuckleball.

The probability of Greg throwing a fastball is 0.7 and the probability of him throwing a knuckleball is 0.3. Notice that the sum of the probabilities of the outcomes is 1 because 0.7 + 0.3 is 1.00.
Next, add branches for each pitch to show the probability for each pitch being a strike, starting with the fastball:

Remember that the probability of Greg throwing a fastball for a strike is 0.6, so the probability of him not throwing it for a strike is 0.4 (since 0.6 + 0.4 = 1.00)
Repeat this process for the knuckleball:

Remember that the probability of Greg throwing a knuckleball for a strike is 0.2, so the probability of him not throwing it for a strike is 0.8 (since 0.2 + 0.8 = 1.00)
Now that the probability tree diagram has been completed, you can perform your outcome calculations. Remember that the sum of the probability outcomes has to equal one:

Since you are trying to figure out the probability that Greg will throw a strike on any given pitch, you have to focus on the outcomes that result in him throwing a strike: fastball for a strike or knuckleball for a strike:

The last step is to add the strike outcome probabilities together:
0.42 + 0.06 = 0.48
The probability of Greg throwing a strike is 0.48 or 48%.
Probability Tree Diagrams: Key Takeaways
· A probability tree diagram is a handy visual tool that you can use to calculate probabilities for both dependent and independent events.
· To calculate probability outcomes, multiply the probability values of the connected branches.
· To calculate the probability of multiple outcomes, add the probabilities together.
· The probability of all possible outcomes should always equal one. If you get any other value, go back and check for mistakes.
Keep Learning!
Check out the animated video lessons below to learn more about tree diagrams and probability.
Check out the video lessons below to learn more about how to use tree diagrams and calculating probability in math:
Keep Learning with More Free Lesson Guides:


Have thoughts? Share your input in the comments section below!
(Never miss a Mashup Math blog--click here to get our weekly newsletter!)
By Anthony Persico
Anthony is the content crafter and head educator for YouTube's MashUp Math. You can often find me happily developing animated math lessons to share on my YouTube channel . Or spending way too much time at the gym or playing on my phone.