Which Linear Inequality is Represented by the Graph?—3 Examples
Your easy guide to matching a linear inequality with its graph.

Guide Preview: Matching linear inequalities with their graphs.
As you progress in algebra and begin expand your understanding of graphing linear inequalities, you will begin to see higher-level thinking questions that challenge how well you understand the topic.
One of the most common linear inequality questions that you will see on quizzes, tests, and exams is a question that asks which linear Inequality is represented by the graph?
These types of questions will include a graph with a shaded region along with four choices, each of which is a linear inequality (typically in the form y>, y≥, y<, or y≤).
Luckily, these types of questions are relatively easy and straightforward to solve, especially when you can use the process of elimination to narrow down your choices and eventually select the correct answer. This free step-by-step guide to solving questions that ask which linear Inequality is represented by the graph? will teach you to do just that.
Quick Review: Linear Inequalities Represented by Graphs
Before you learn how to match a linear inequality with its graph, it’s important to remember two things about linear inequalities:
Solid Lines vs. Dotted Lines
Shading Above vs. Shading Below
Solid Lines vs. Dotted Lines
Linear inequalities of the form y≤ and y≥ have solution sets that include the points on the line. They are graphed using a solid line.
Linear inequalities of the form y< and y> have solution sets that include the points on the line. They are graphed using a solid line.
Shading Above vs. Shading Below
Linear inequalities of the form y> and y≥ have a shaded region above the line. (Remember, greater than means shade above).
Linear inequalities of the form y< and y≤ have a shaded region below the line. (Remember, less than means shade below).
If you can remember these two important characteristics of linear inequalities, you will have a much easier time matching linear inequalities with their graphs. Before you move onto the examples, take a look at the visual summary shown in Figure 01 below.

Figure 01
Example #1: Which Linear Inequality is Represented by the Graph?
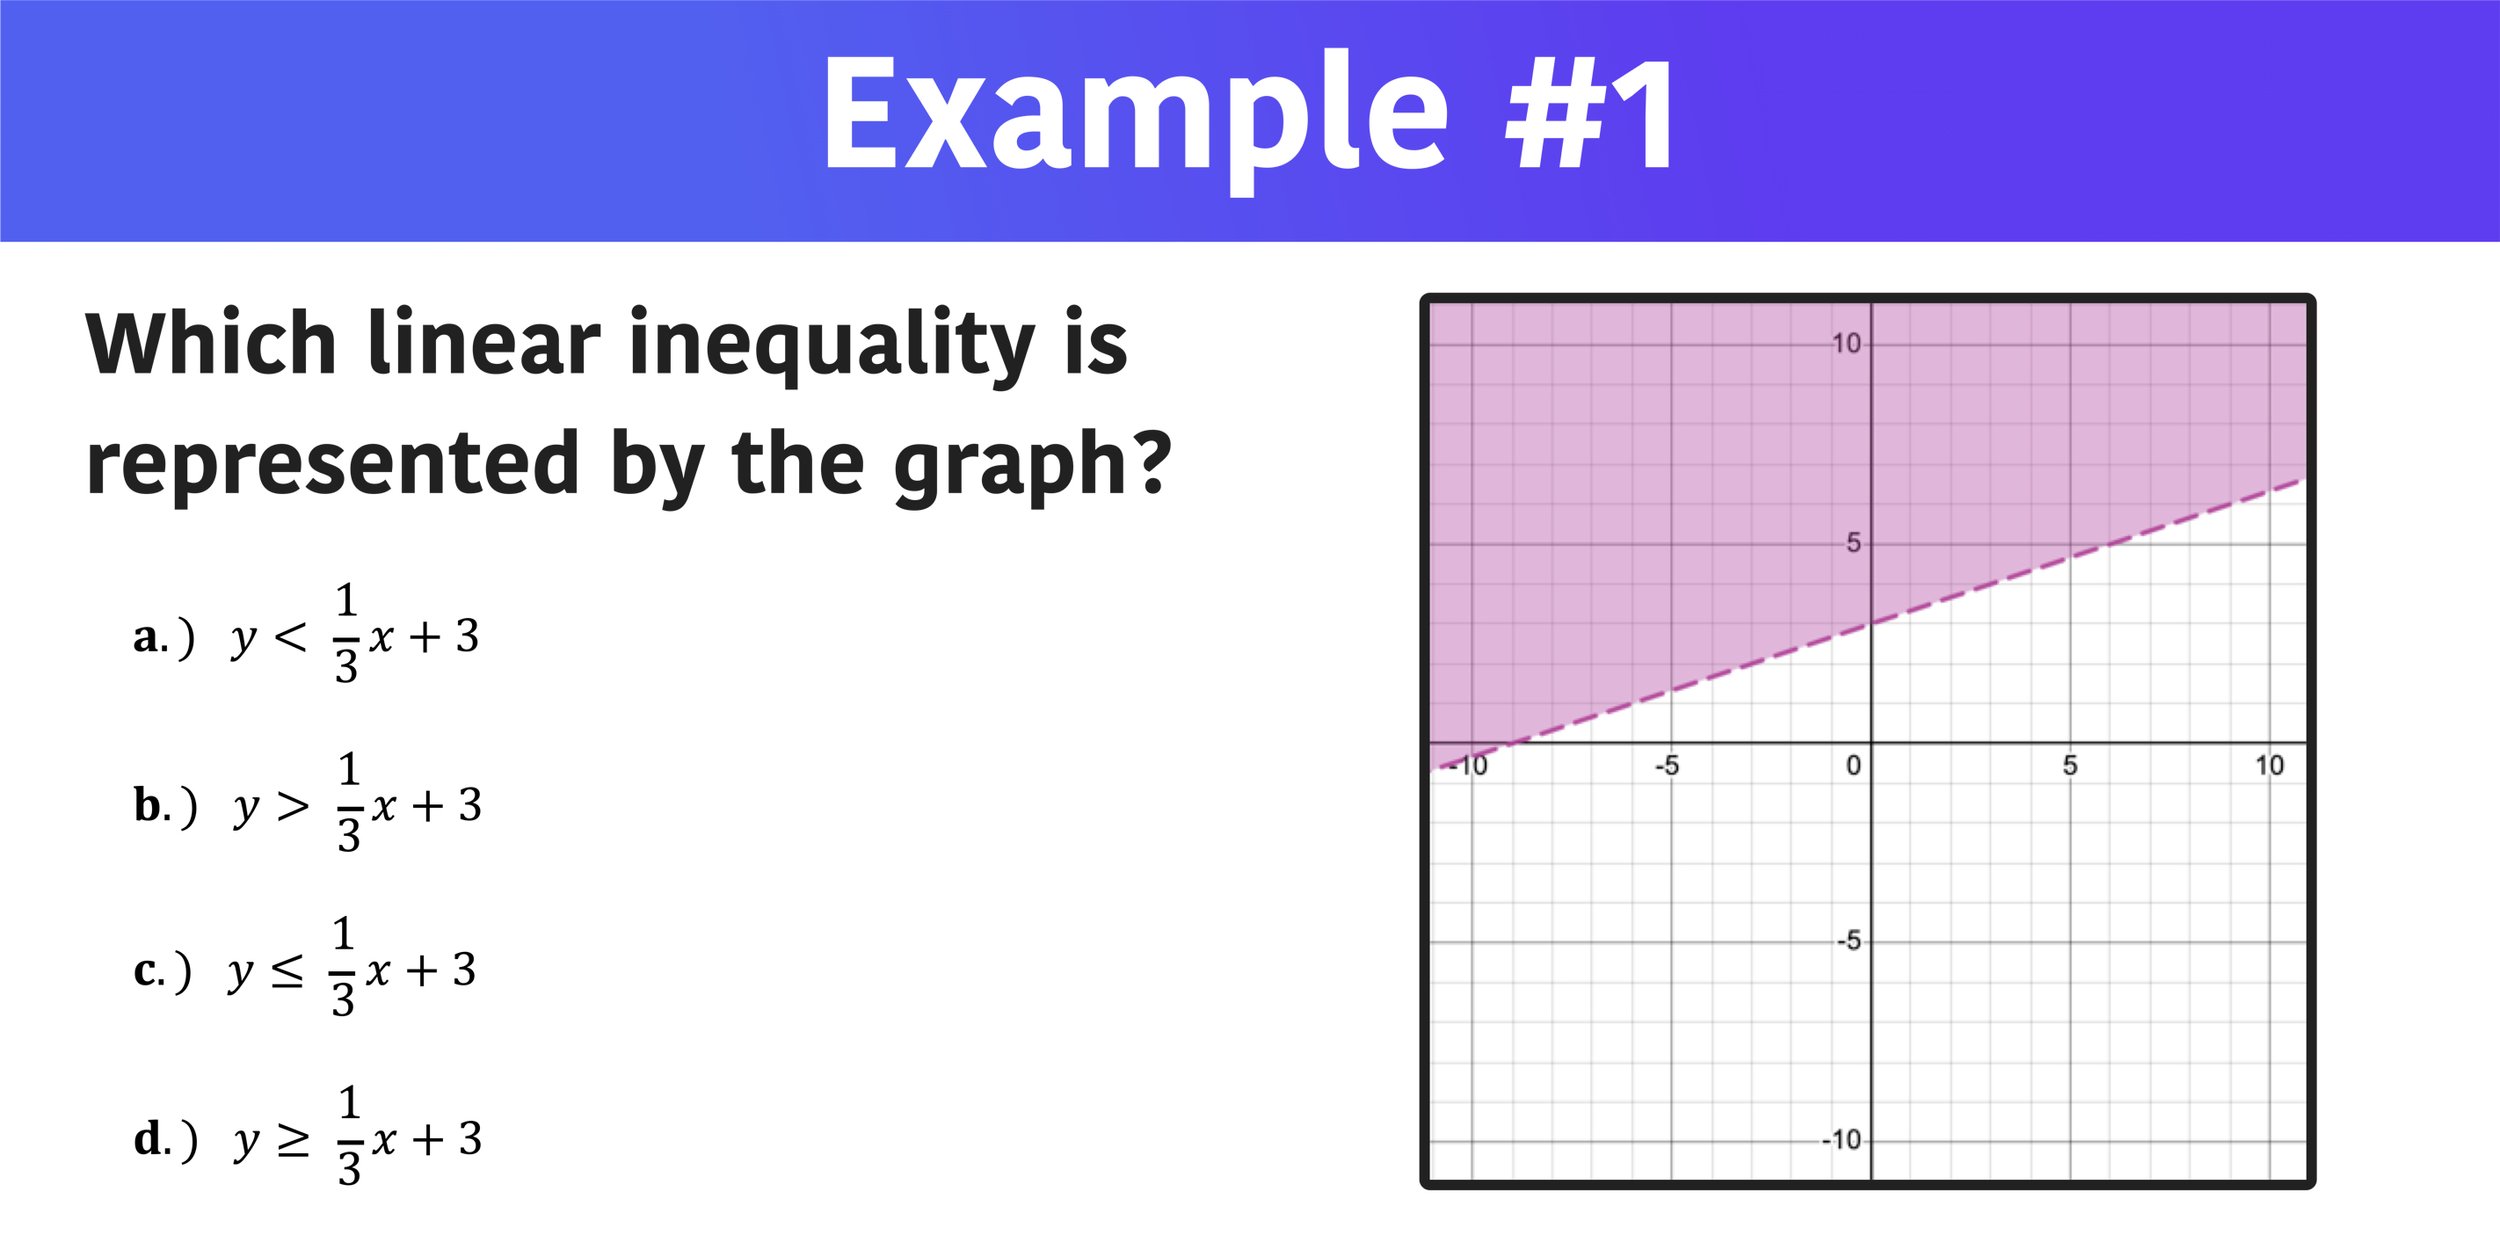
Example 01: Which linear inequality is represented by the graph shown?
Which linear inequality matches the graph? a) y<1/3x+3 b) y>1/3x+3 c) y≤1/3x+3 d) y≥1/3x+3
If you remembered the review information about inequalities in regard to solid versus dotted lines and shading above a line versus shading, then finding the correct answer in example #1 is actually a pretty easy process. Let’s start by looking at the line of the linear inequality on the graph. Since the line is dotted, we know that the symbol has to be either < or >, so we can eliminate choices C and D right away.

Next, take a look at where the shaded region of the linear inequality is in reference to the line. Notice that the shaded region is above the graph, which means that the inequality symbol must be > (not <), so you can go ahead and eliminate choice A, leaving choice B as the correct answer.
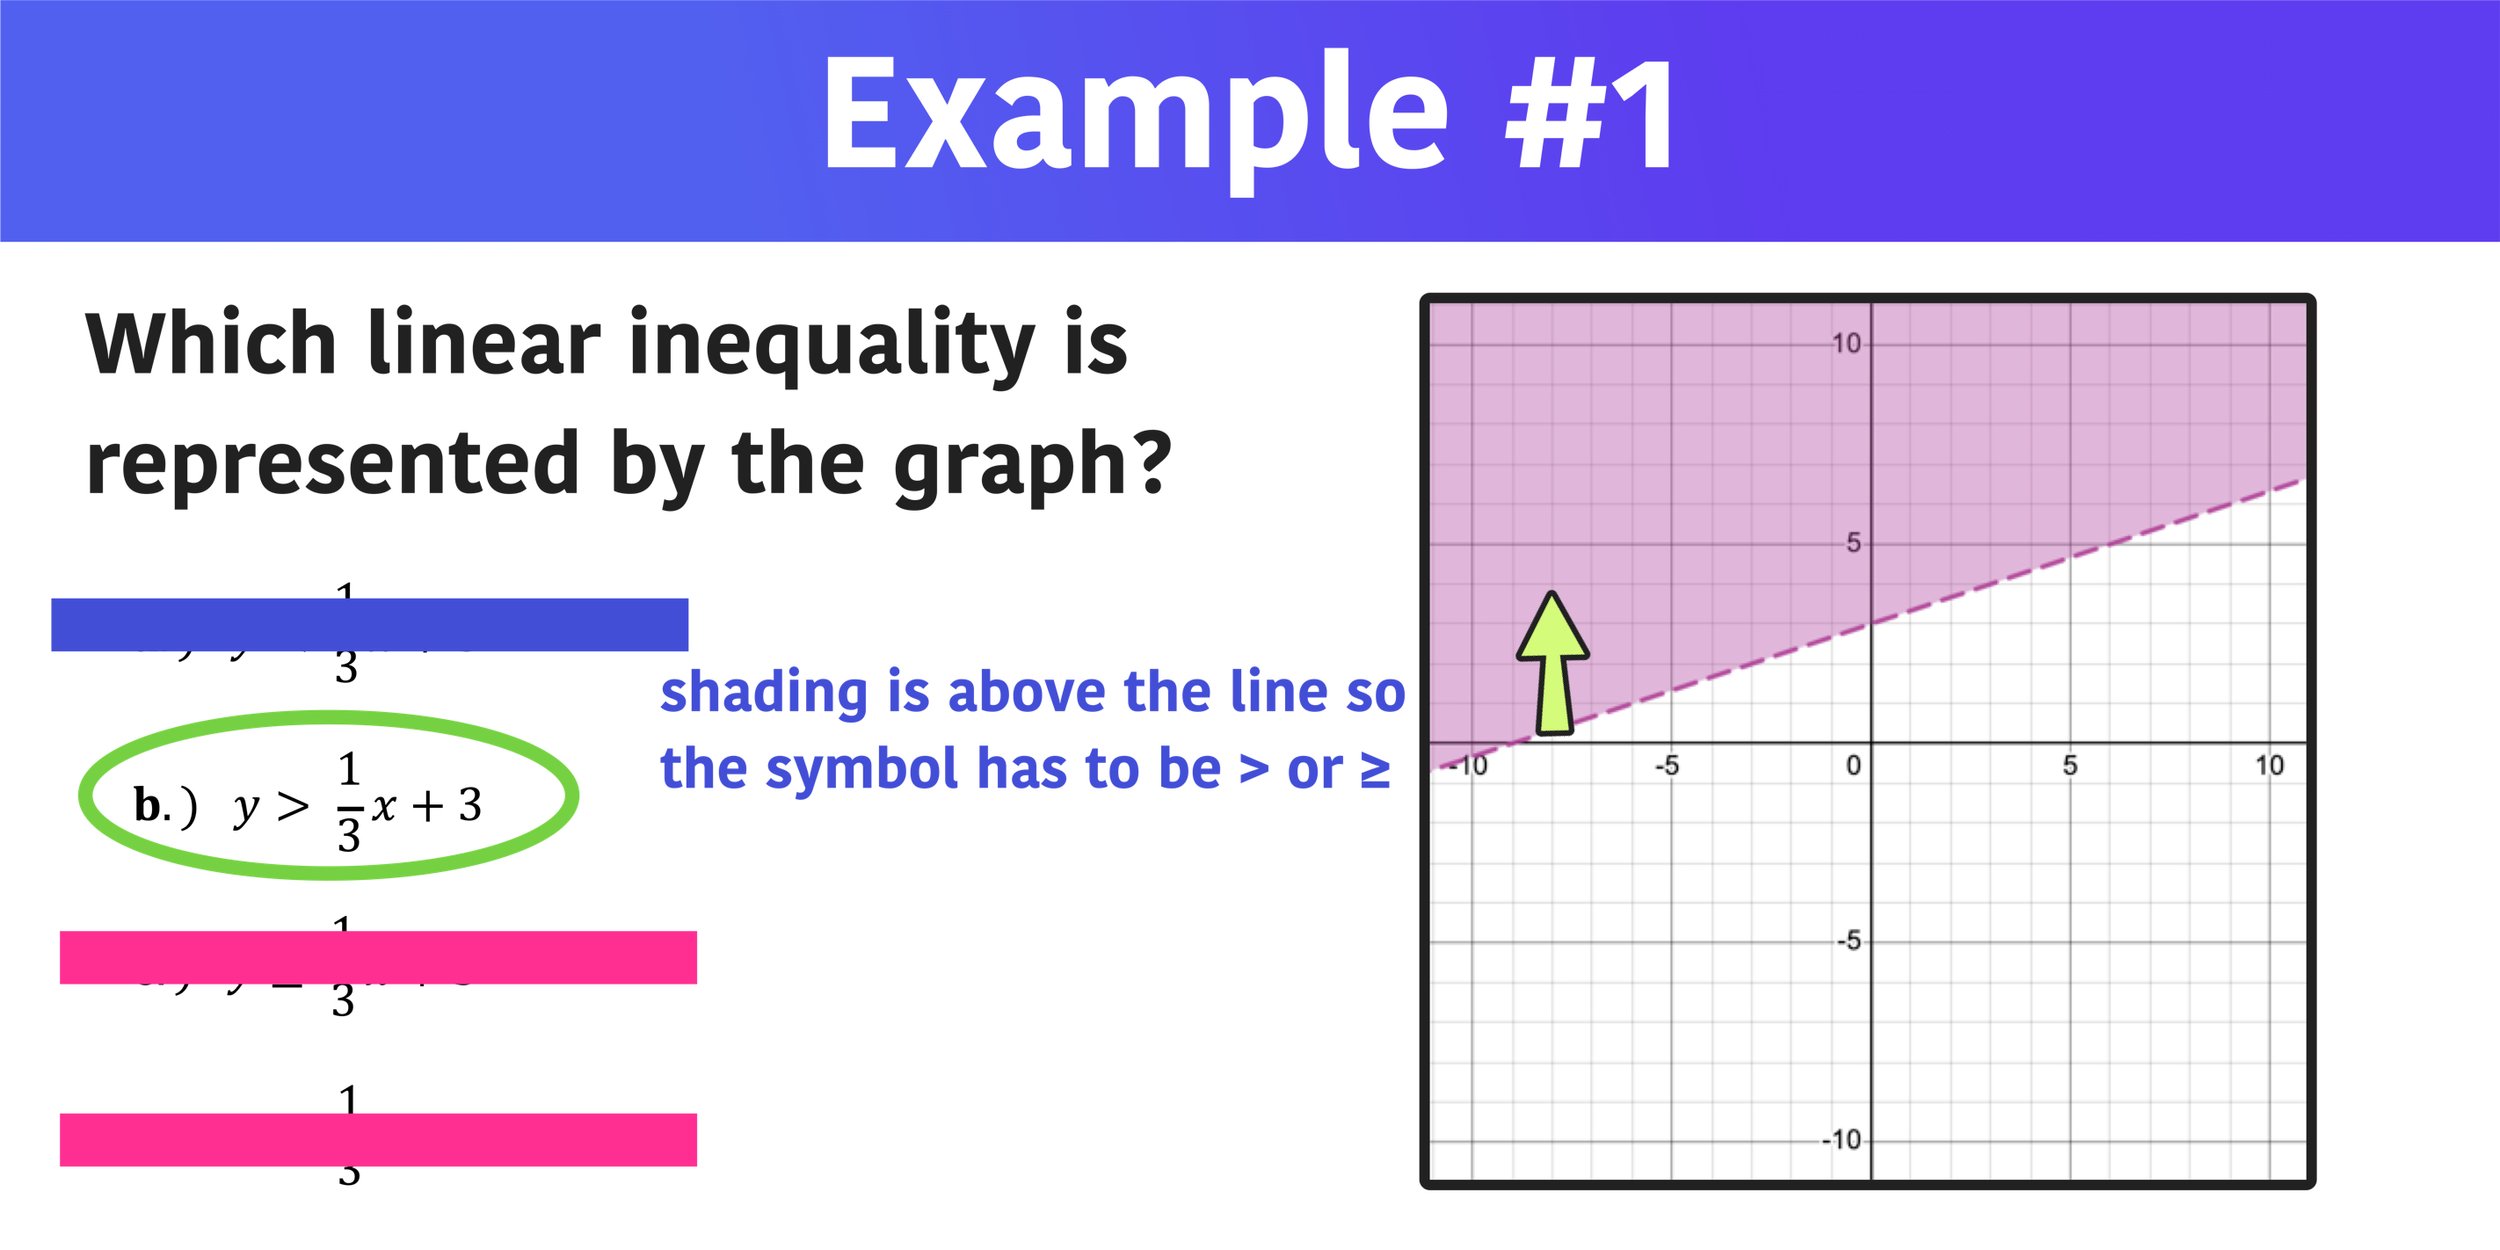
Choice B is the correct answer.
Pretty easy, right? You will be able to solve many problems using this approach, but not all of them will be this simple. Let’s take a look at a few more examples.
Example #2: Which Linear Inequality is Represented by the Graph?
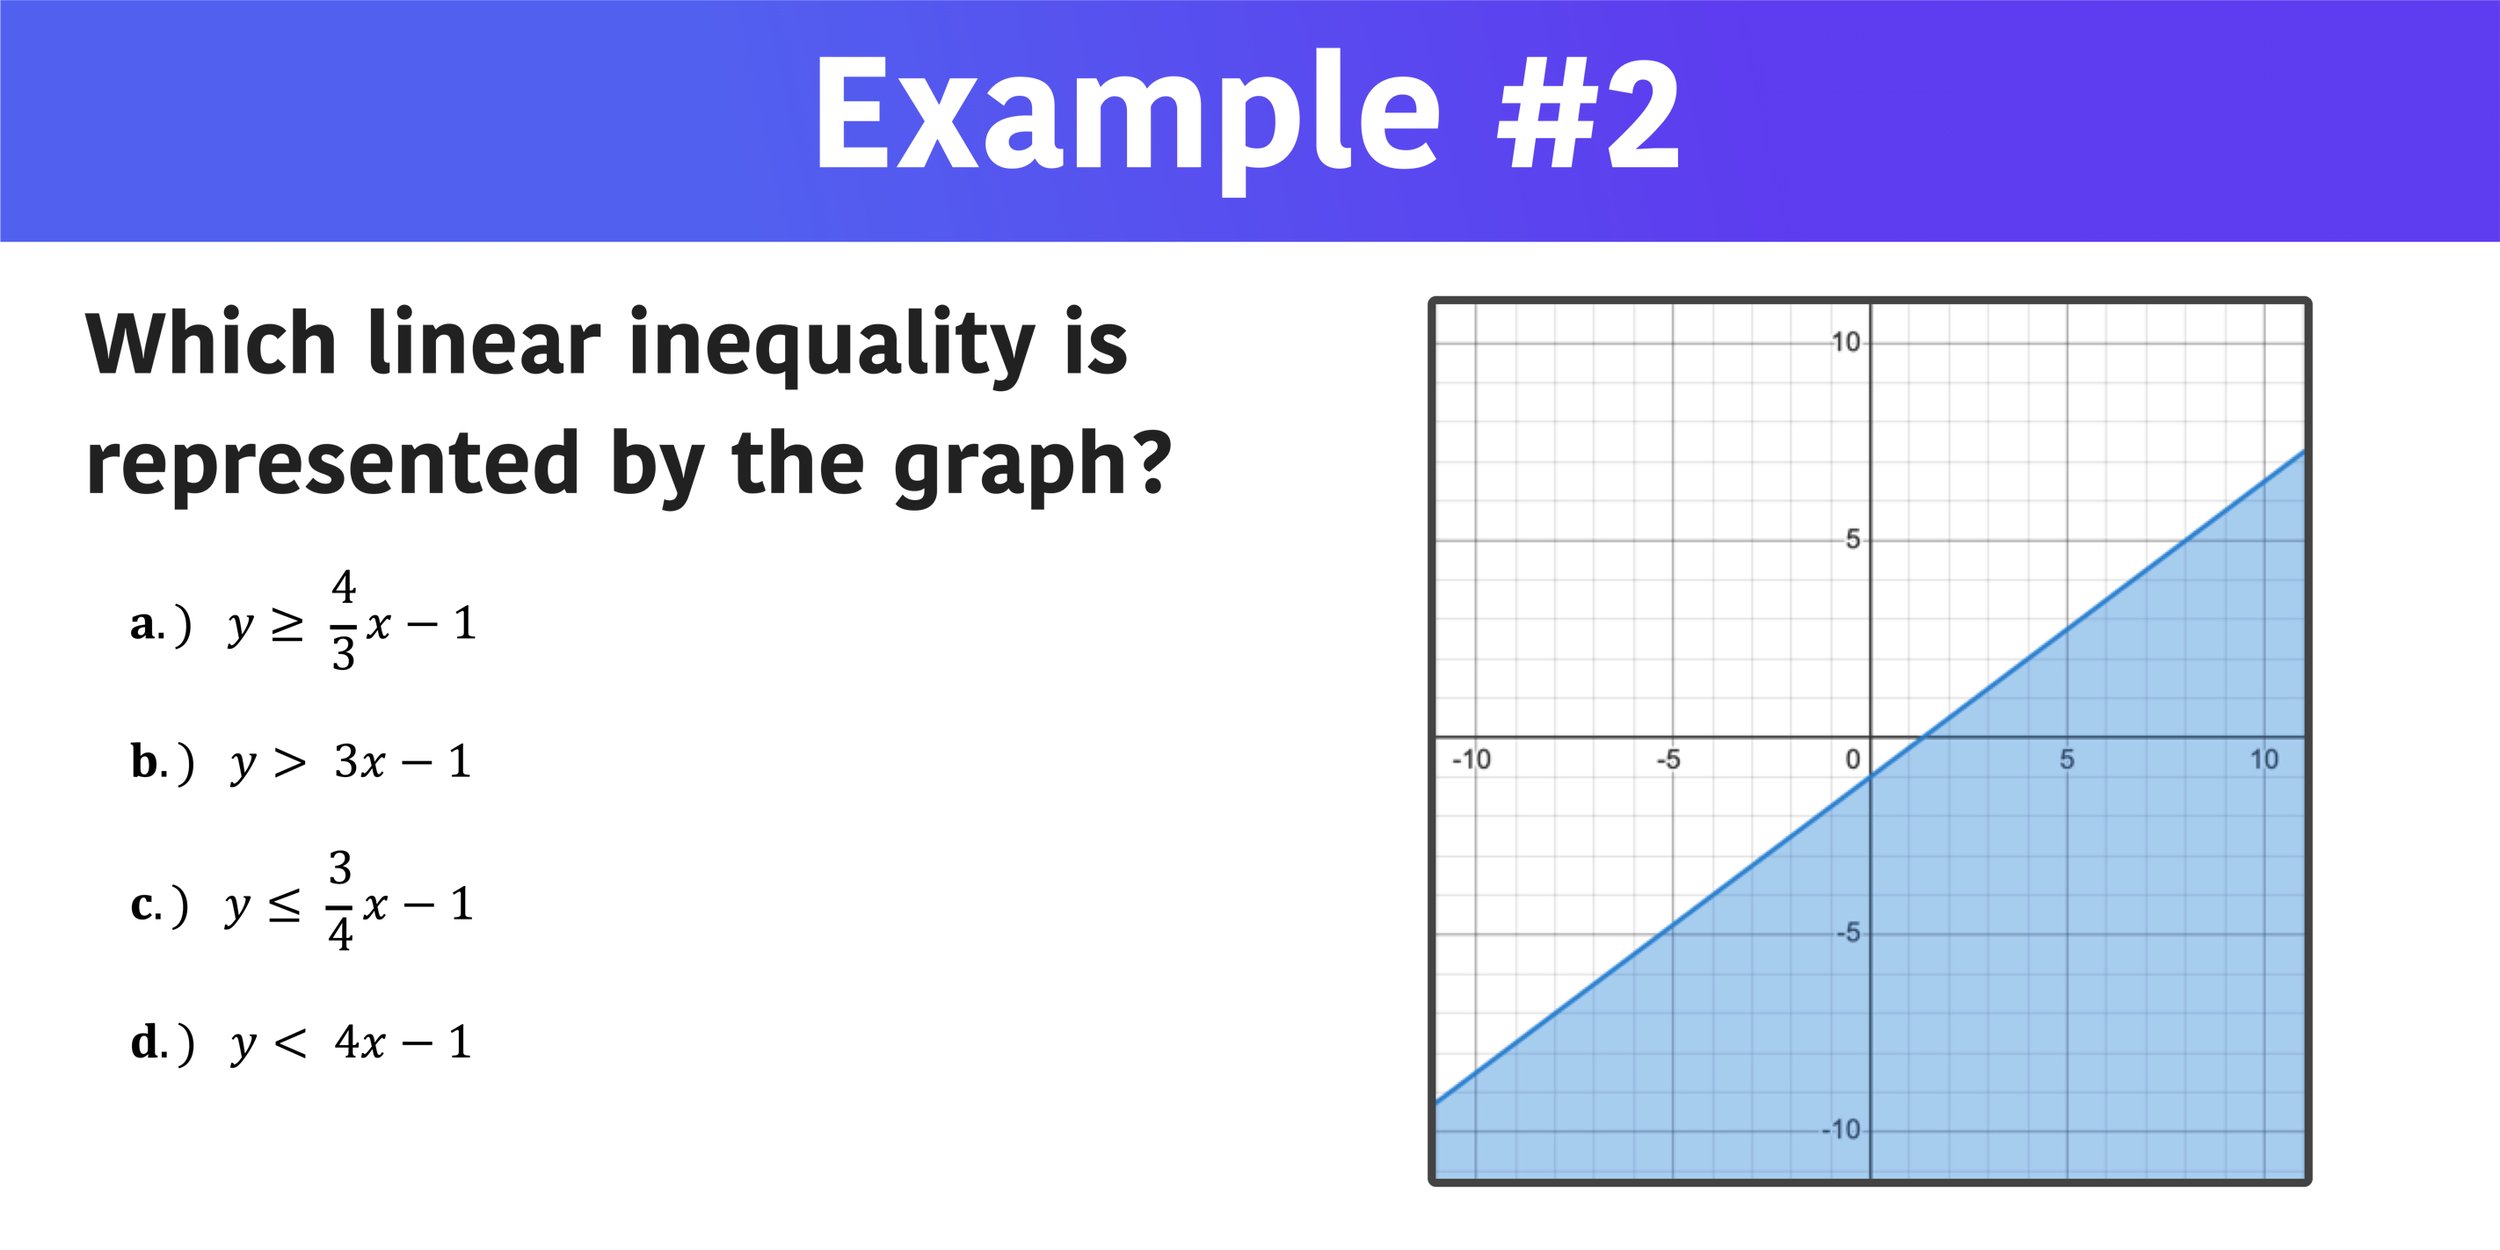
Example 02: Which linear inequality is represented by the graph shown?
Which linear inequality matches the graph? a) y≥4/3x-1 b) y>3x-1 c) y≤3/4x-1 d) y<4x-1
Just like the first example, you can apply your understanding of graphing linear inequalities to eliminate choices and determine the correct answer. First, take a look at the line shown on the graph. Is the line solid or dotted?
In this example, the line is solid, so you know that the inequality associated with this graph must be ≥ or ≤. Therefore, you can eliminate choices B and D since they do not have the right inequality symbols.

The next step is to determine whether the answer is choice A or choice C. To do that, observe where the shaded region of the linear inequality is in reference to the line. Is the shaded region above the line or below the line?
Since the shaded region is below the line, the inequality symbol must be ≤, which allows you to eliminate choice A and conclude that choice C is the correct answer.

Are you starting to get the hang of matching linear inequalities with their graphs? Let’s take a look at one more example.
Example #3: Which Linear Inequality is Represented by the Graph?

Example 03: Which linear inequality is represented by the graph shown?
Which linear inequality matches the graph? a) y<x+5 b) y<x-2 c) y>x-0.5 d) y>x+1.5
Do you notice anything different about this third example compared to the first two? All of the inequality symbols are either > or <, so we can not eliminate any choices based on the line (solid or dotted) since all of the linear inequalities will have dotted lines.
However, you can still figure out the correct answer by applying your understanding of linear inequalities and linear relationships.
Since you can’t eliminate any choices based on the type of line shown, you can move onto trying to eliminate choices based on the location of the shaded region in reference to the line.
In this example, the shaded region is above the line, so the inequality symbol has to be >, so you can eliminate choices A and B.

You can eliminate choices A and B because they do not have the correct inequality symbol.
Now you are left with two possible solutions: C) y>x-0.5 and D) y>x+1.5
Both of these linear inequalities are of the form y>mx+b (similar to linear equations of the form y=mx+b) where m represents the slope of the line and b represents the y-intercept.
You can see that both of these linear inequalities have the same slope, but different y-intercepts. Choice C crosses the y-axis at -0.5 and Choice D crosses the y-axis at 1.5. Notably, C has a negative y-intercept and D has a positive y-intercept. By looking at the graph, where does the line intercept the y-axis?
It is clear that the y-intercept is above zero on the y-axis, which means that it is positive. Furthermore, the graph shows that the line crosses the y-axis between positive 1 and positive 2, so it makes sense that the y-intercept would be 1.5 and that choice D would be the correct answer.

And you’re all finished! If you want some more experience with matching linear inequalities with their graphs, I highly recommend working through these three examples again on your own. Also, check out the free resources below to learn more about working with inequalities.
More Math Resources You Will Love: