Which Graph Represents a Function?—Examples
Your easy guide to determining whether or not a graph represents a function.

Guide Preview: Which graph represents a function?
When dealing with functions in math, it is important to be able to recognize whether or not a given graph represents a function or not. This short guide will explore and answer the questions:
When is a relation in the form y= or f(x)= a function?
What is the vertical line test?
Which graph represents a function?
By exploring the answers to the questions above (as well as several practice problems and examples), you will learn to easily identify whether or not a given graph represents a function or not using a simple test called the Vertical Line Test. Once you master this skill, you will be able to solve any math problem that asks which graph represents a function and which graph represents a function with direct variation?
These types of math questions often include four possible choices, each of which is an image of a graph on the coordinate plane. To get the correct answer, you will have to choose which of the four graphs represents a function.
Fortunately, these types of questions are straightforward and relatively simple to answer correctly, especially when you can use the process of elimination to eliminate choices and then eventually find the solution. Are you ready to get started?
Quick Review: What is a Function?
Definition: In math, a function is a relation between a set of inputs and outputs where, for every input, there is one (and only one) output. ,
The key takeaway, as shown in Figure 01 and Figure 02, is that, a function is a relation where every input has only one output. For a relation to be a function, each x-value input can have only one y-value output. Or, in other words,
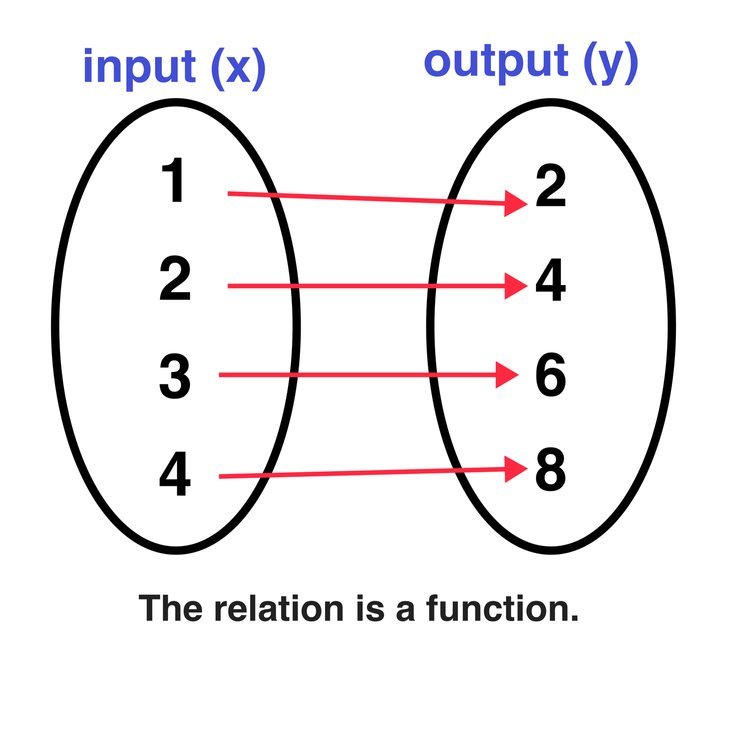
Figure 01: The relation is a function because each x-value (input) has only one output.

Figure 02: The relation is a not a function because at least one x-value (6 in this case) has more than one output.
Quick Review: What is the Vertical Line Test?
Now that we have reviewed how to determine whether or not a relation is a function by looking at a mapping, we can review how to do the same thing by looking at the graph of a function on the coordinate plane by applying the Vertical Line Test.
The Vertical Line Test is a visual tool that you can use to determine whether or not a given relation is a function. To use the vertical line test to see if a graph represents a function or not, use the following three steps:
Step One: Draw one or multiple vertical lines that pass through the graph.
Step Two: Count how many times the vertical line(s) intersected the graph.
Step Three: Make a determination:
If any vertical line intersects the graph at only one point, the relation is a function.
If any vertical line intersects the graph at more than one point, the relation is not a function.
For example, the graph in Figure 03 below represents a function because it passes the vertical line test (the vertical line intersects the graph at only one point) . Conversely, the graph in Figure 04 below does not represent a function because it fails the vertical line test (the vertical line intersects the graph at more than point).

Figure 03: The graph represents a function because it passes the vertical line test.

Figure 04: The graph does not represent a function because it fails the vertical line test.
For more information on how to determine whether or not a relation is a function using the vertical line test, click the following link to access our free step-by-step student guide: The Vertical Line Test Explained in 3 Easy Steps (with Examples)
Otherwise, let’s continue onto working through some examples where you have to determine which graph represents a function?
Example #1: Which Graph Represents a Function?
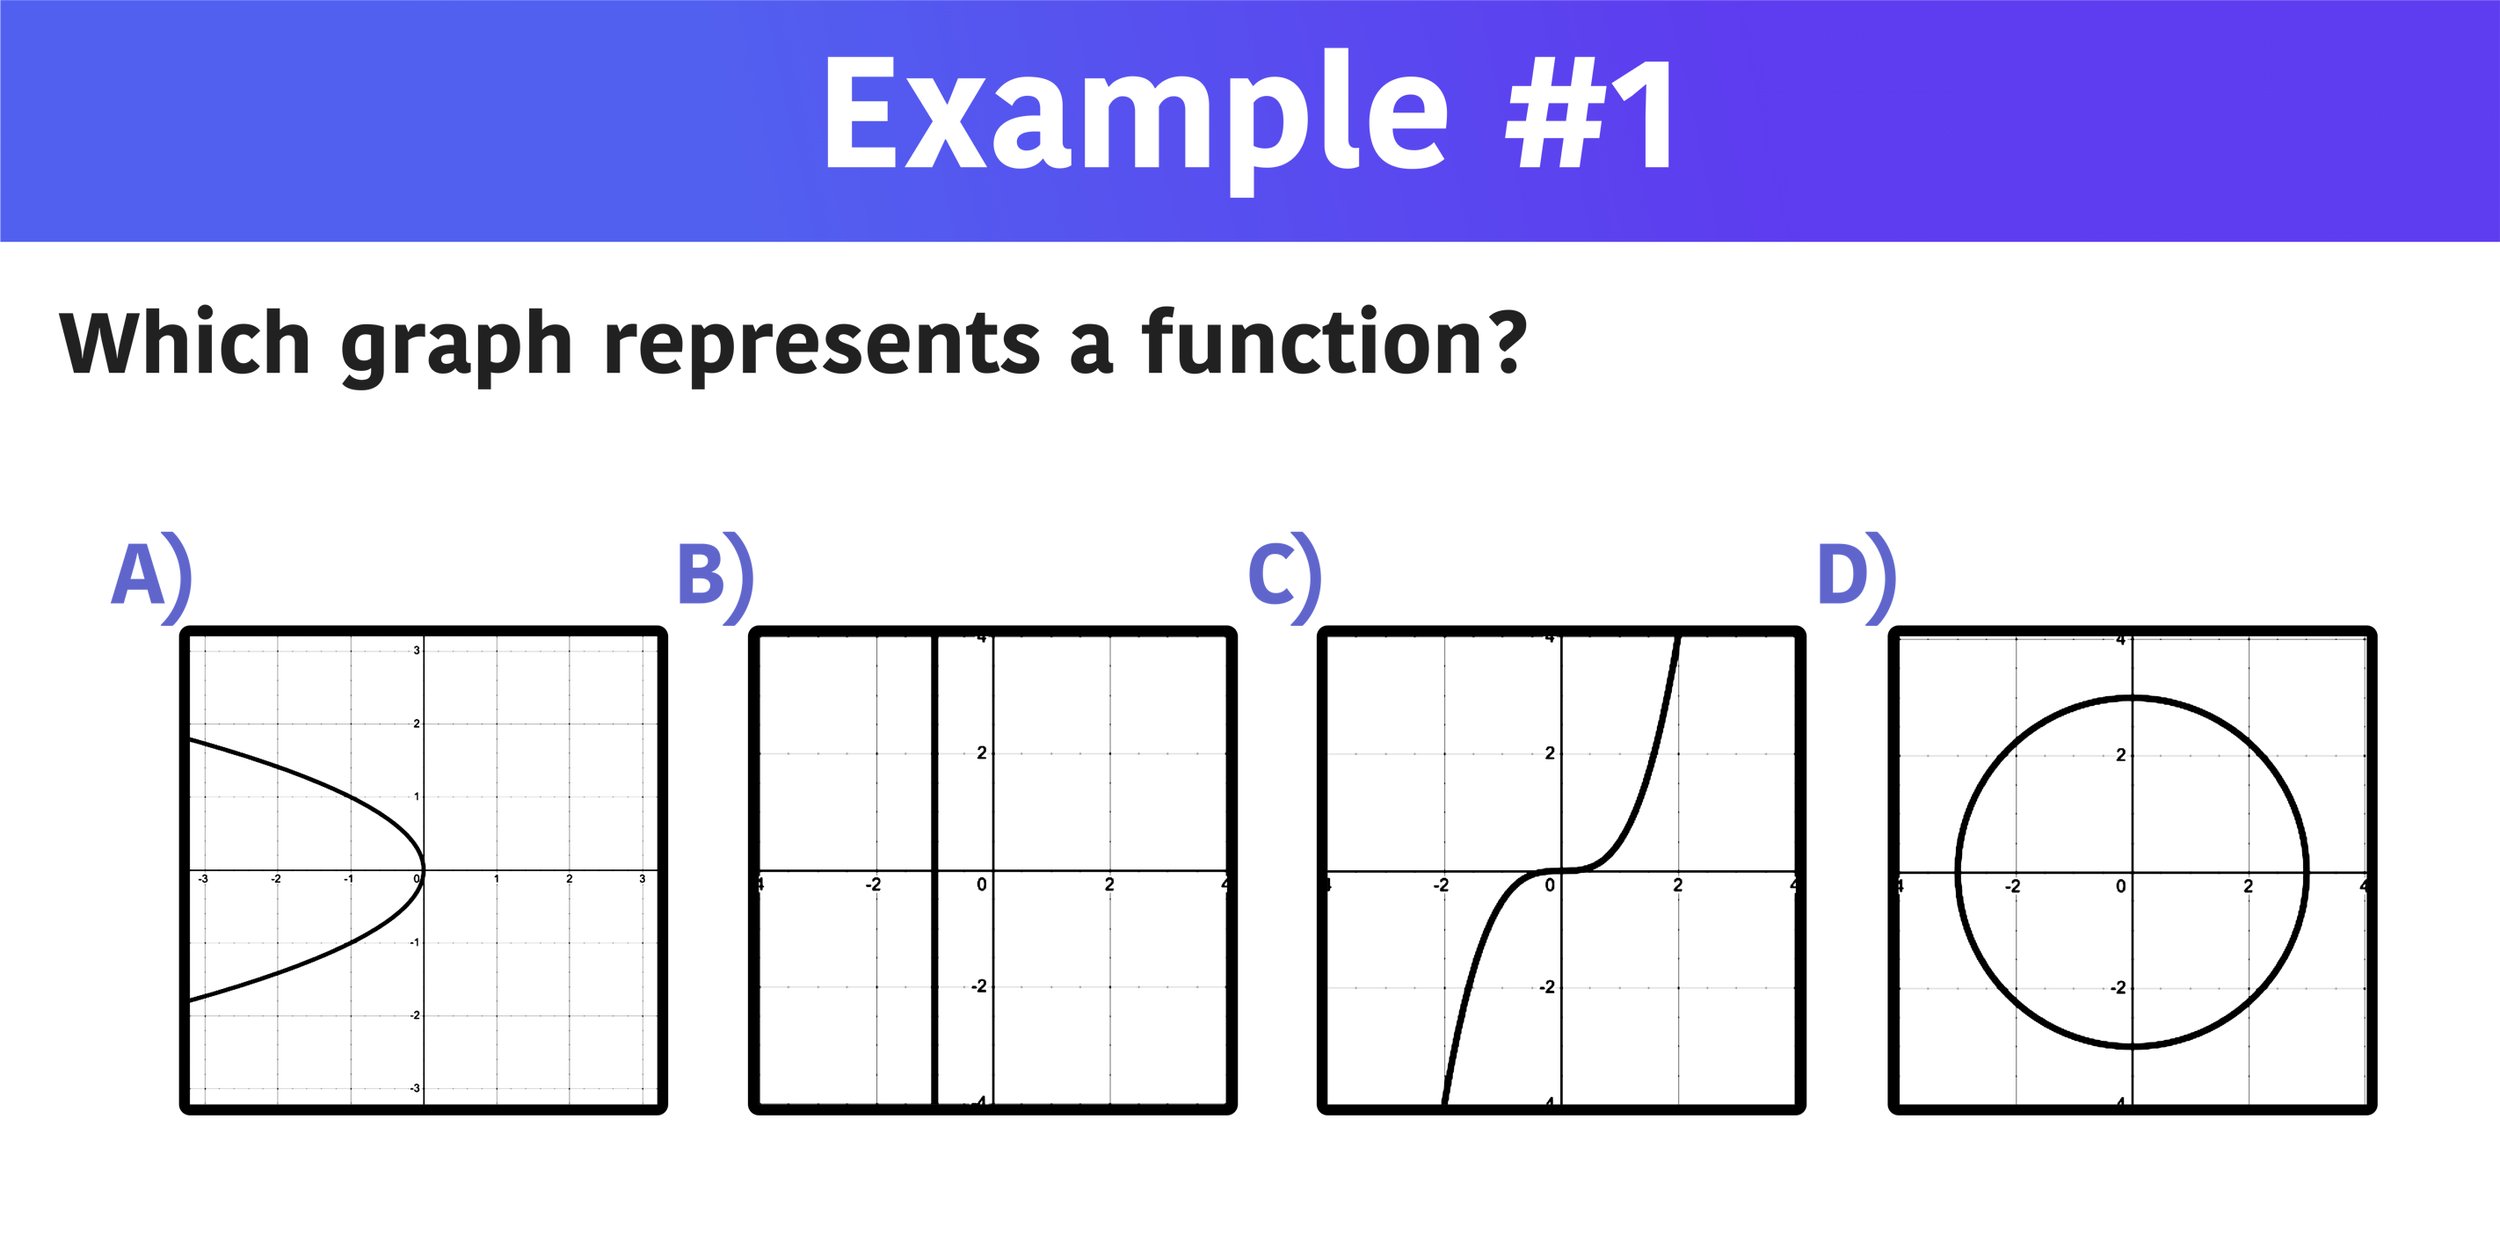
Example #1: Which graph represents a function?
In this first example, you are given four graphs and you must figure out which one of them represents a function.
To solve this first example, simply apply the vertical line test to each graph to see which one passes. The graph that does not fail the vertical line test will be the solution.
After applying the vertical line test, it is clear that the graphs in choices A, B, and D all fail the vertical line test because the vertical line intersects the graphs at more than point (graphs A and D have two intersection points and graph B has an infinite amount of intersection points). However, graph C passes the vertical line test because the vertical line intersects the graph at only one point.
Therefore, the only graph that represents a function is choice C.

Which graph represents a function? C is the answer because the graph passes the vertical line test.
Example #2: Which Graph Represents a Function?

Example #2: Which graph represents a function?
Just like the previous example, you are given four graphs and you have to identify the one that represents a function.
Again, apply the vertical line test to each graph to find the one that passes.
After applying the vertical line test, you can see that graphs A, C, and D all fail the vertical line test because the vertical line intersects the graphs at more than point, while graph B passes the vertical line test because the vertical line intersects the graph at only one point.
So, the graph that represents a function is choice B.

Which graph represents a function? B is the answer because the graph passes the vertical line test.
Which Graph Represents a Function with Direct Variation?
At this point, you can answer most questions that require you to figure out whether or not a graph represents a function. However, you will sometimes see questions that ask you to determine which graph represents a function with direct variation?
In math, direct variation refers to a linear relationship of the form y=kx, where k is a constant. For a graph to represent a function with direct variation, it must be linear (a straight line) and it must pass through the origin (the point (0,0).
Figure 05 below shows examples of functions with direct variation. Notice that each function is both linear AND passes through the origin.
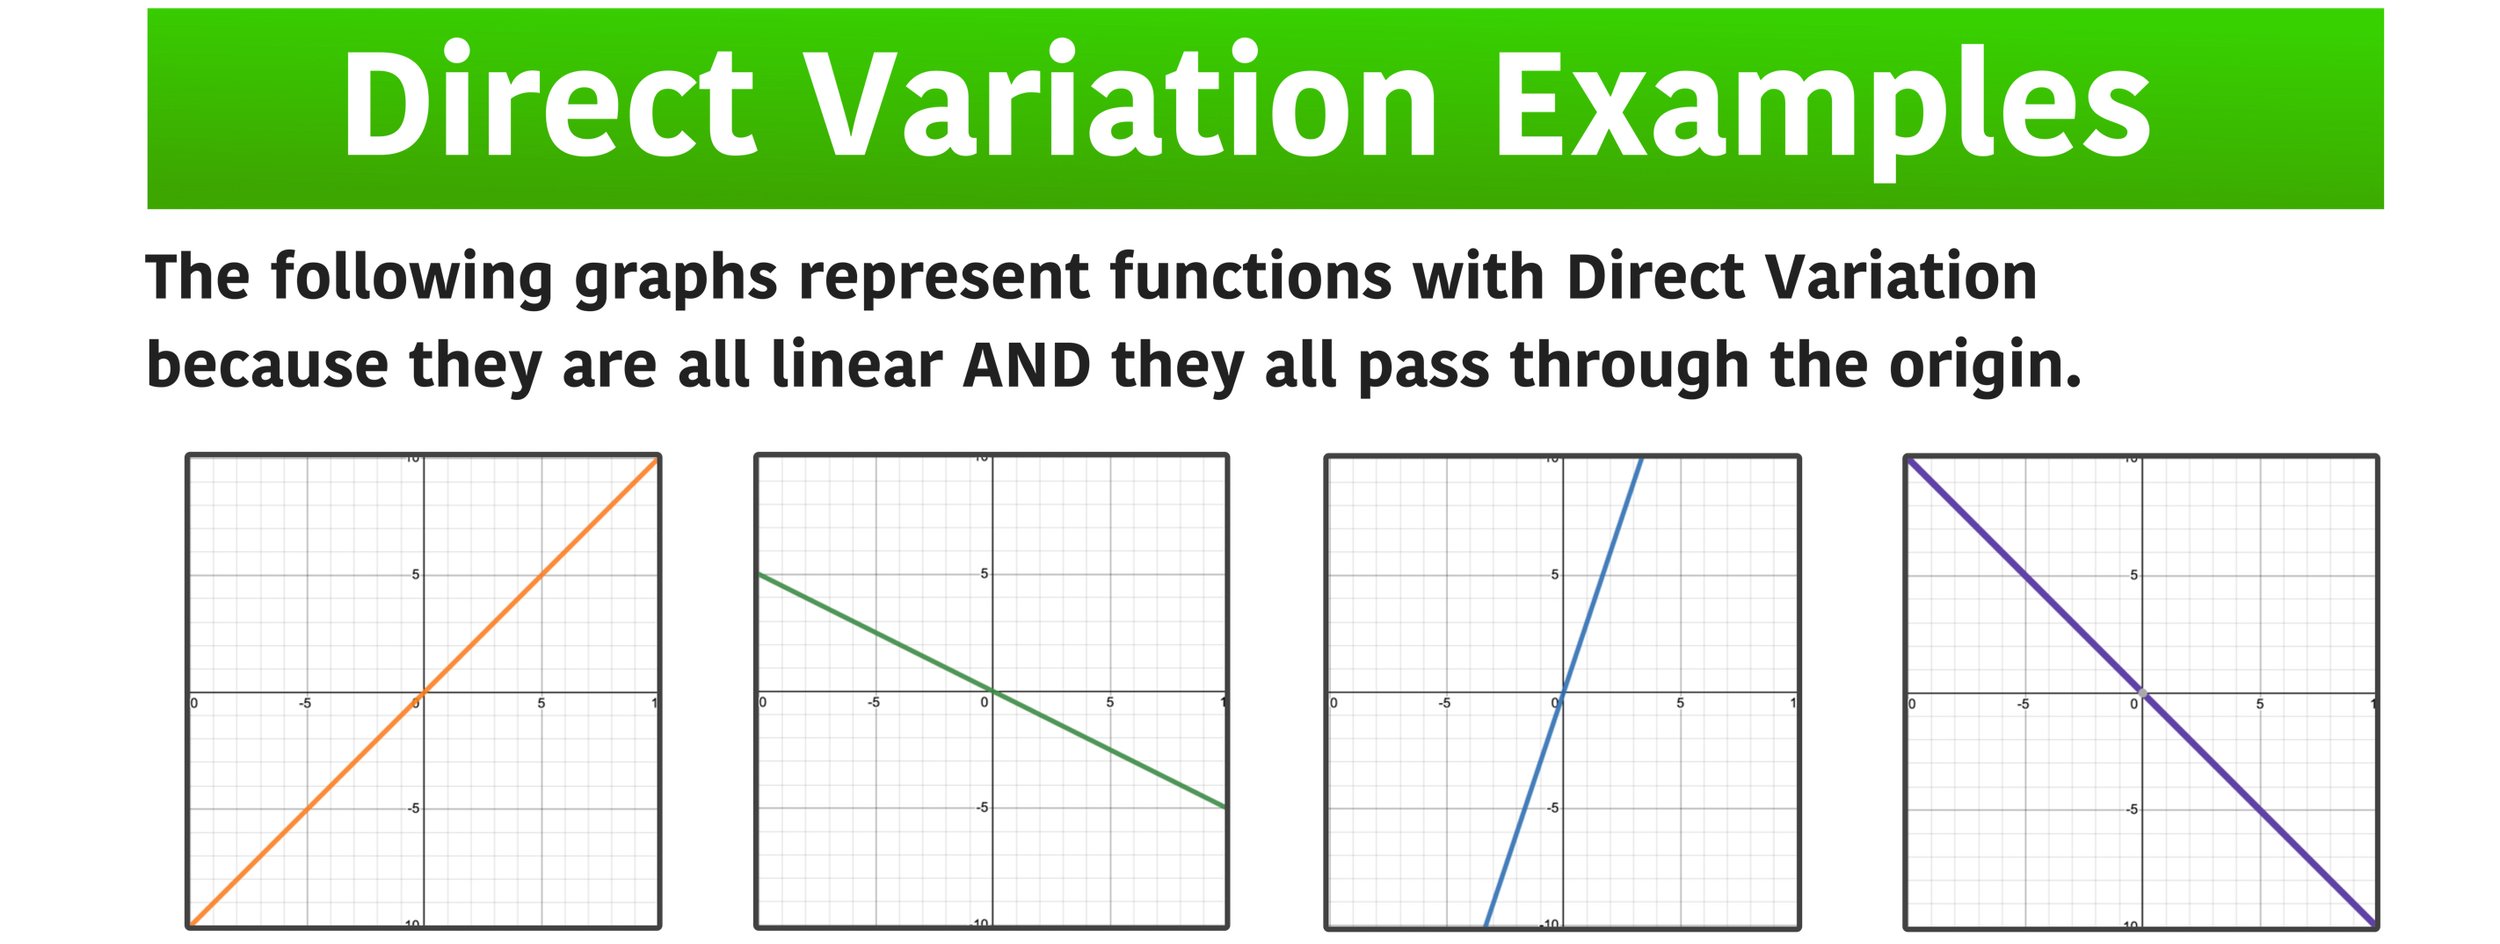
Figure 05: Which graph represents a function with direct variation? All of these functions have direct variation because they are both linear and pass through the origin.
Conversely, Figure 06 below shows examples of functions that do not have direct variation (i.e. non-examples). Notice that each function is either non-linear or does not pass through the origin (or both).

Figure 06: Which graph represents a function with direct variation? None of these functions have direct variation because they are either non-linear or do not pass through the origin.
Now that you understand how to identify a function with direct variation, let’s take a look at a practice problem similar to examples #1 and #2.
Example #3: Which Graph Represents a Function with Direct Variation?

Example #1: Which graph represents a function with direct variation?
To solve Example #3, you will take the same approach as Examples #1 and #2. Use what you know about the graphs of functions to eliminate choices and find the correct solution.
For this example, you are looking to identify the graph that represents a function AND has direct variation. So, you can start by using the vertical line test to eliminate any graphs that do not represent functions at all.
The vertical line test shows that you can eliminate choices C and D because both graphs fail the vertical line test, meaning that they do not represent functions at all.
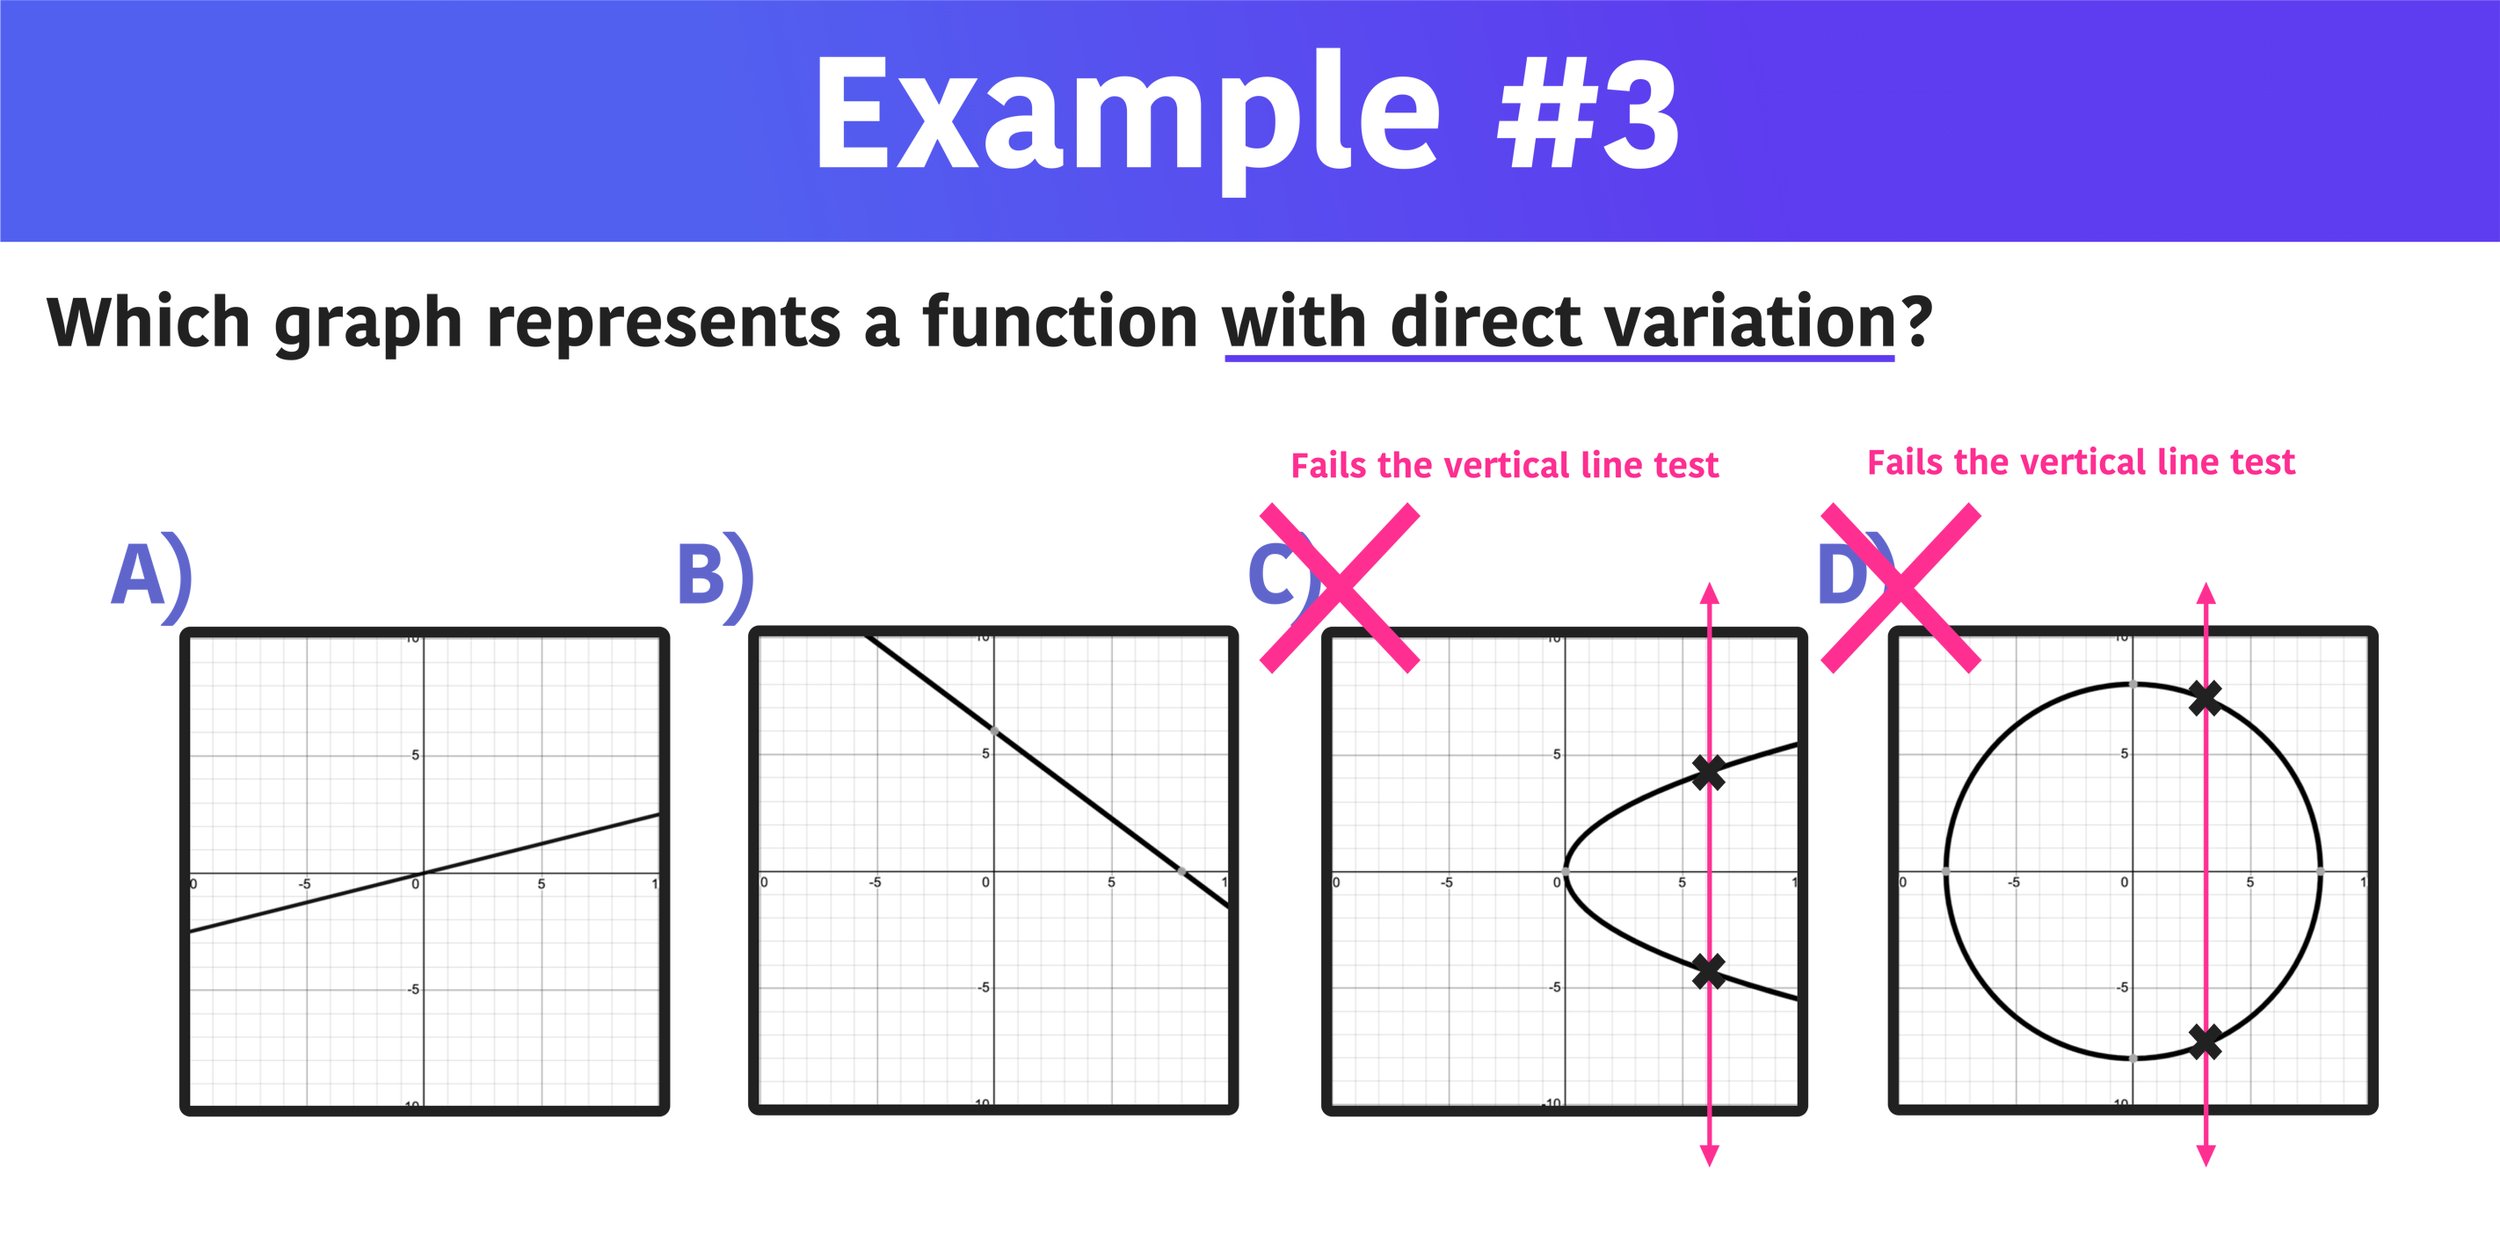
Choices C and D do not represent functions with direct variation because they are not functions at all (they both fail the vertical line test).
Now, you are left with the linear graphs shown in choices A and B. The vertical line test shows that both graphs do indeed represent functions, but what about functions with direct variation?
Remember that a graph that represents a function with direct variation must be linear AND pass through the origin at (0,0). Looking at choices A and B, it is clear that only choice A passes through the origin, so you can eliminate choice B and conclude that only graph A represents a function with direct variation.
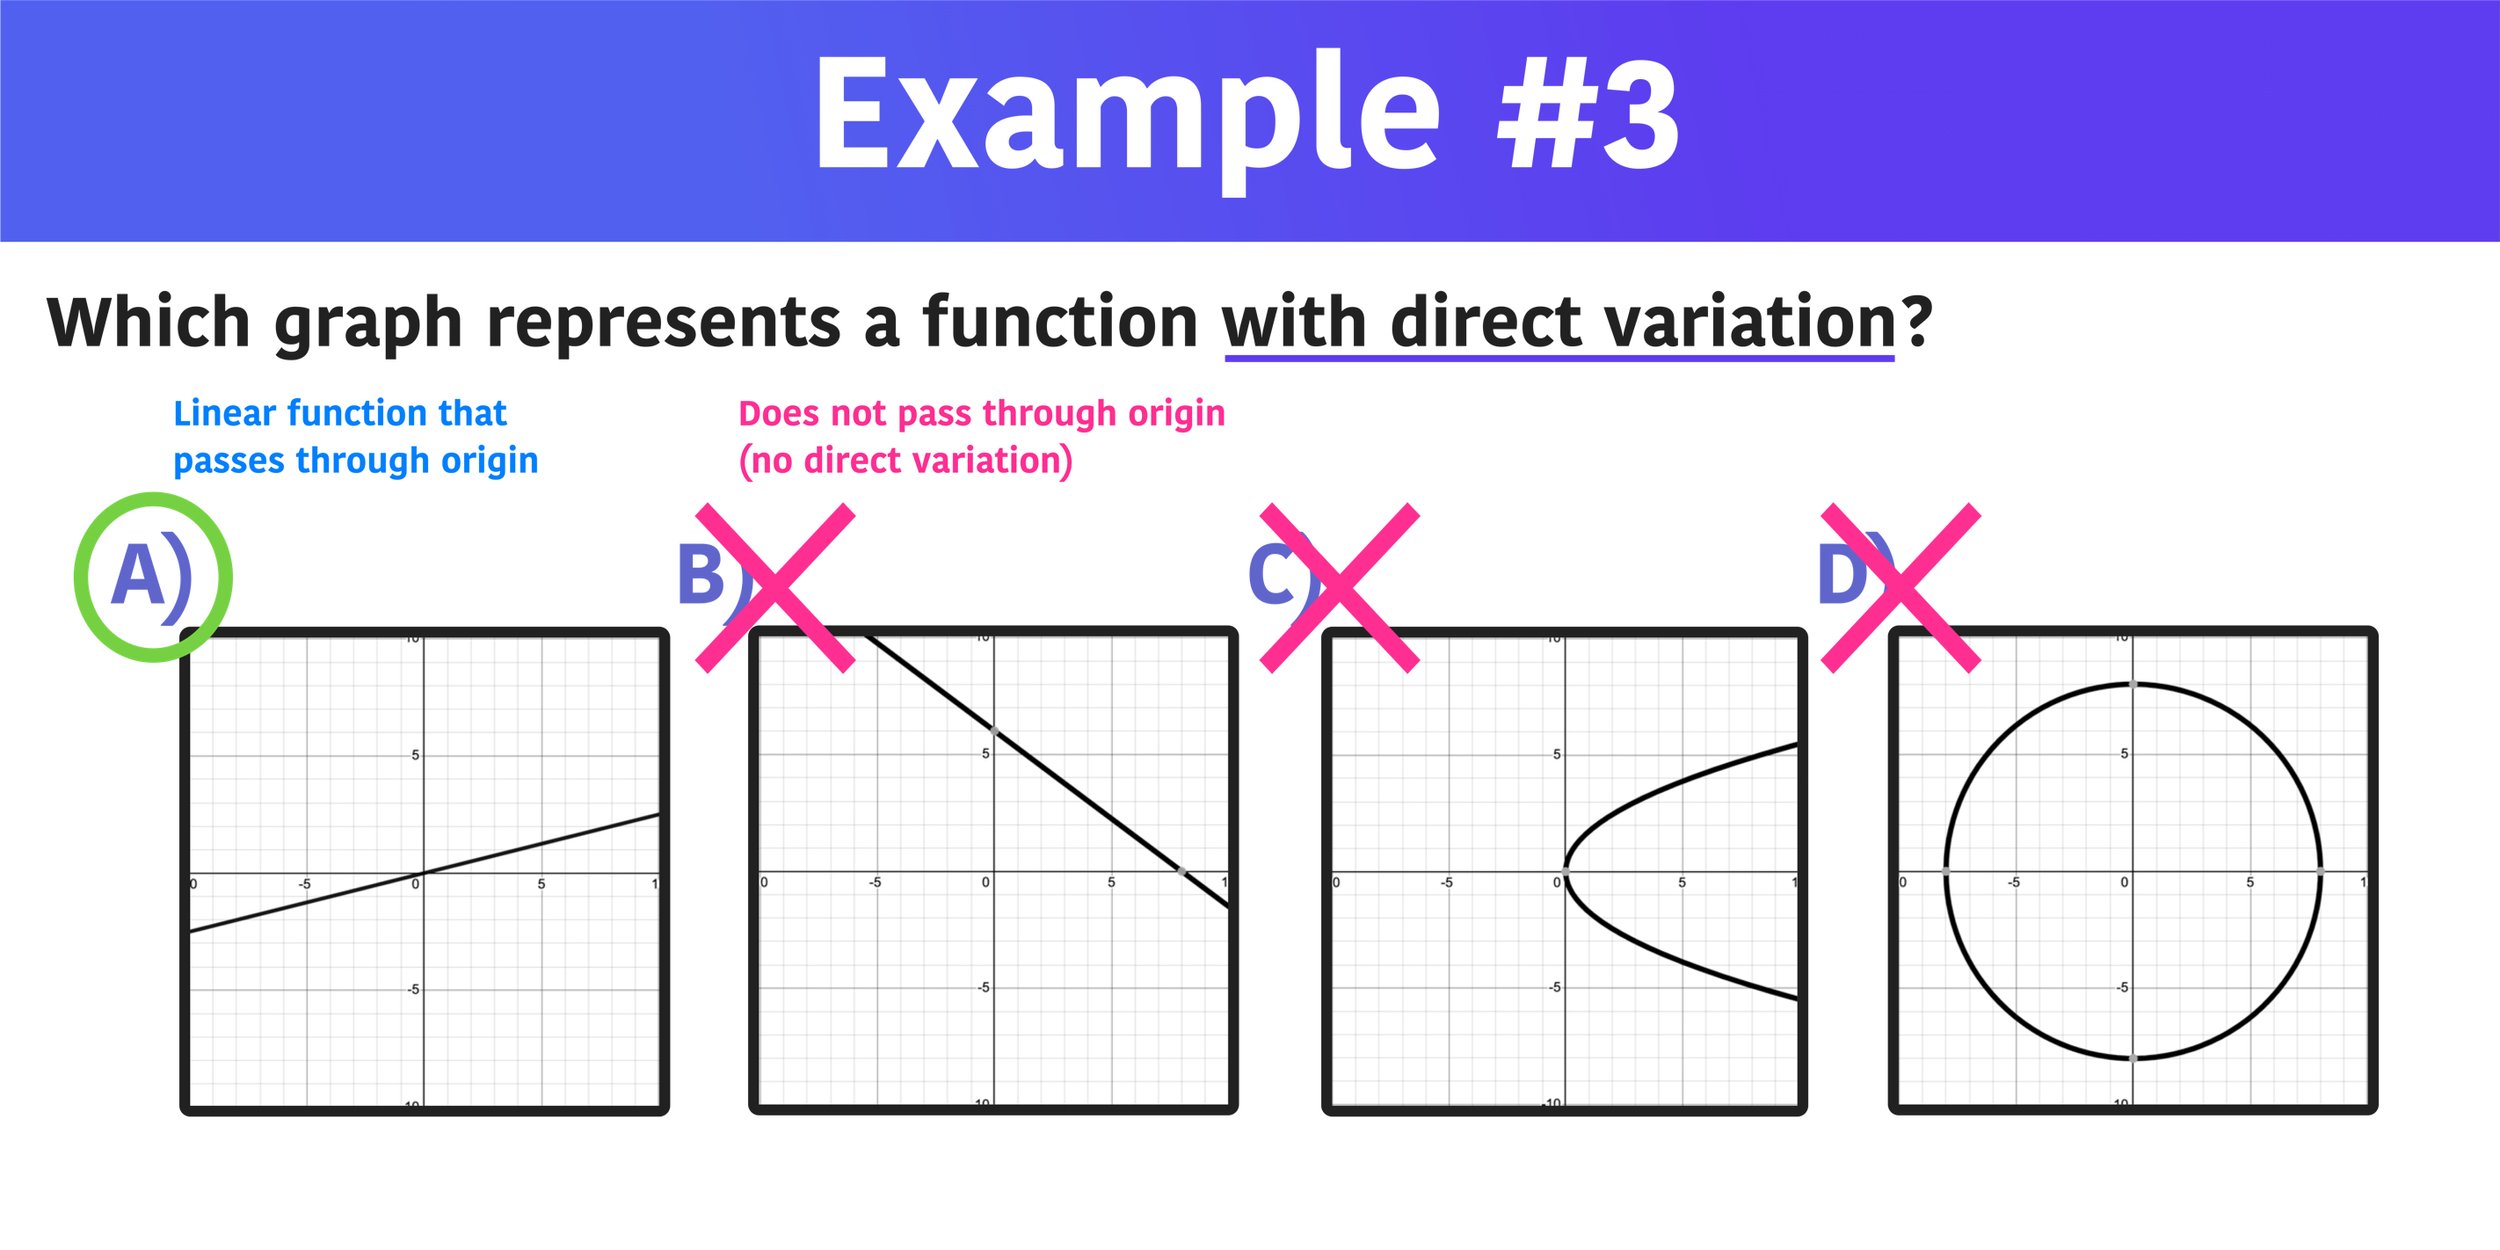
Which graph represents a function with direct variation? A is the answer because the graph represents a linear function that passes through the origin.
More Math Resources You Will Love: