How to Graph a Parabola in 3 Easy Steps
Your complete guide to graphing a parabola on the coordinate plane
Guide Preview: How to graph a parabola.
In algebra, it is important to understand the behavior of quadratic functions and their graphs. This short guide will cover the following key concepts (including examples):
How to graph a parabola?
How to graph a parabola in standard form?
Graphing a parabola on the coordinate plane
What is the vertex of a parabola?
A quadratic function in standard form looks like this: f(x)=ax^2+bx+c, where a, b, and c are constants. You can also express a quadratic function in standard form as y=ax^2+bx+c (note that we will be using f(x)= and y= interchangeable in this guide). Graphing a parabola on the coordinate plane by using its formula is an important algebra skill and this lesson guide will teach you a simple 3-step process that you can use for graphing a parabola in almost any scenario.
Before you learn how to graph a parabola in standard form, let’s review some key concepts and vocabulary related to quadratic functions and their graphs before moving onto a few graphing parabolas examples.
How to Graph a Parabola in Standard Form: Quick Review
A quadratic function in standard form is a function that looks like this: f(x)=ax^2+bx+c.
For example, for the standard form quadratic f(x)=x^2 -4x + 5, a=1, b=-4, and c=5
The graph of a function is a parabola—a U-shaped plane curve that is symmetrical about a line of symmetry that passes through a vertex point. A parabola is symmetrical and forms a mirror image of itself on opposite sides of the line of symmetry that passes through the vertex point.
Figure 01 below shows examples of quadratic functions in standard form along with a corresponding graph. Notice the U-shape parabola for each graph along with the vertex point. Also notice that a parabola can open upward (U-shaped) or open downward (upside-down U-shaped).
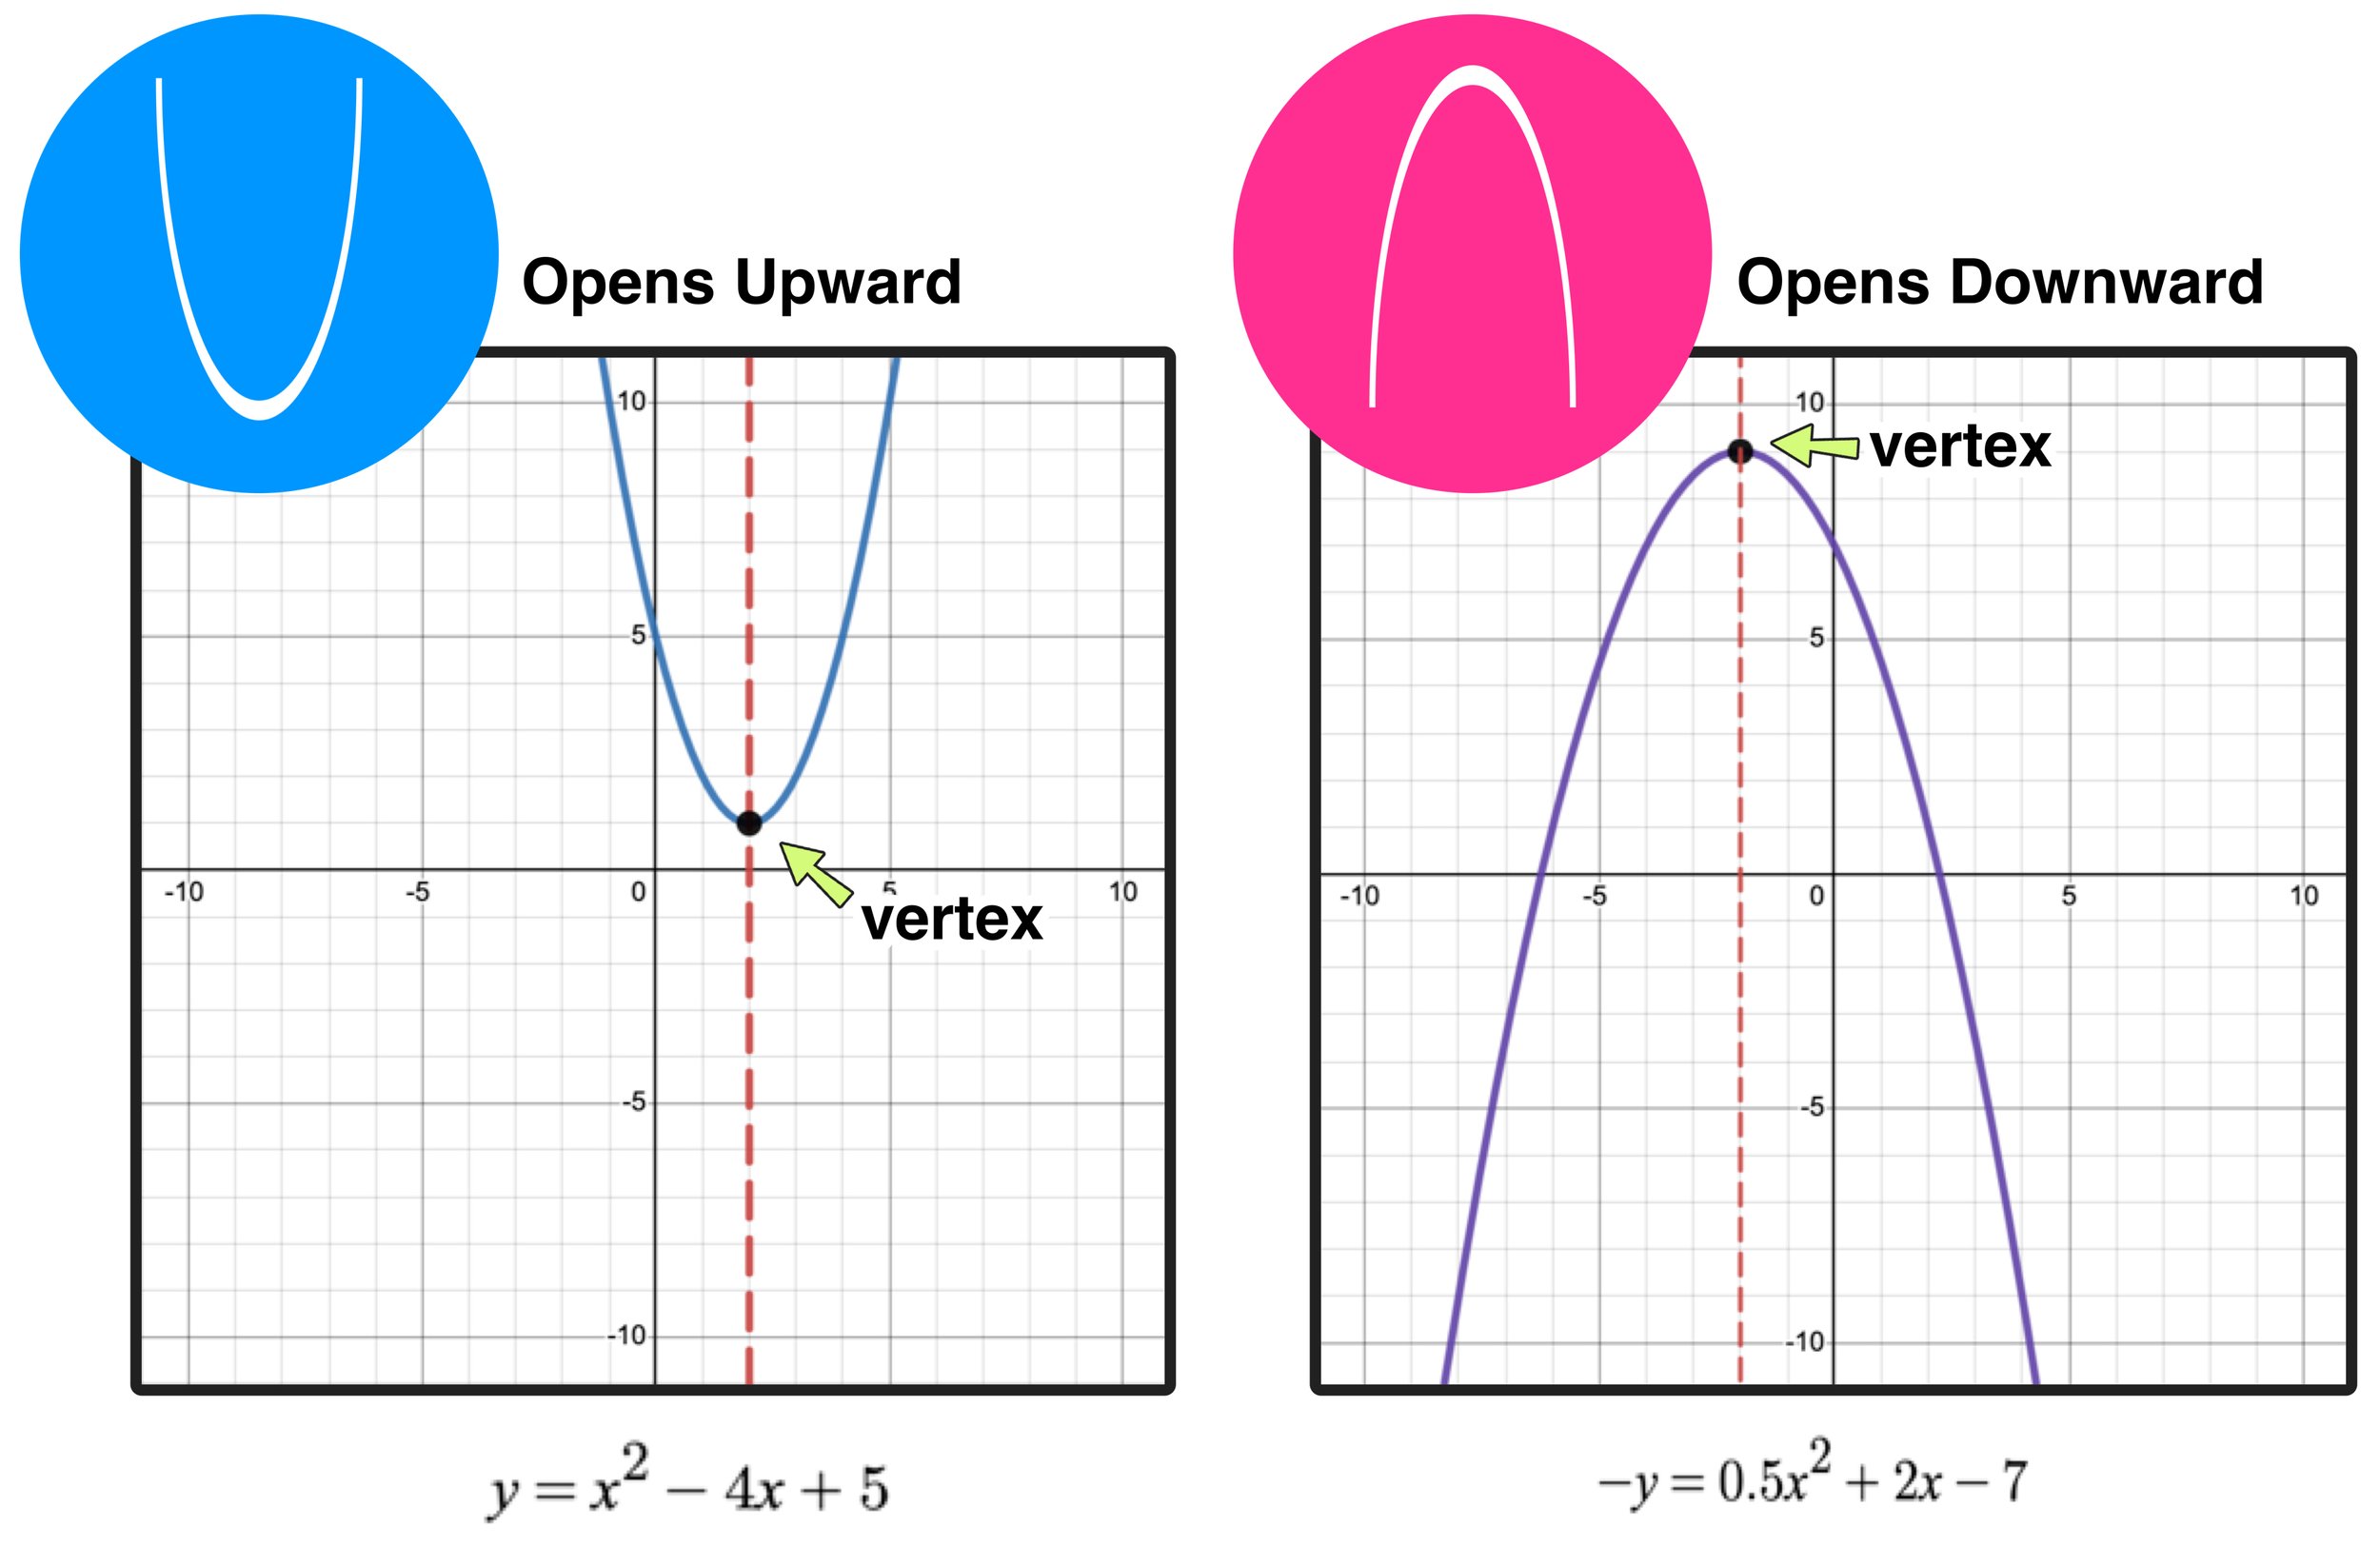
Figure 01: How to Graph a Parabola: Examples of Graphing a Parabola on the Coordinate Plane
Now that you know what the graph of a quadratic function in standard form looks like, let’s take a further look at what the vertex of a parabola is.
What is the Vertex of a Parabola?
The vertex of a parabola is the (x,y) coordinate point where a parabola and its axis of symmetry intersect.
In Figure 01 above, the vertex of a parabola is labeled and the axis of symmetry is the horizontal dashed line that passes through it.
In simpler terms, what is the vertex of a parabola? The vertex is the point at the very bottom of the curve for parabolas that open upward or at the very top of the curve for parabolas that open downward.
If you can find the vertex of a parabola, then you can easily learn how to graph a parabola on the coordinate plane, so understanding what is the vertex of a parabola and how to find it is key. Luckily, finding the vertex of a parabola is easy to do as long as you follow two simple steps:
To find the vertex of a parabola in f(x)=ax^2+bx+c form:
Step A: Use the formula x=-b/2a to find the x-coordinate value of the vertex point.
Step B: Input the x-coordinate value from Step A into the function to find the y-coordinate value.
The key concepts of what is the vertex of a parabola and how to find the vertex of a parabola is shown in Figure 02 below.

Figure 02: What is the vertex of a parabola?
For example, to find the vertex of the parabola represented by the function f(x)=x^2 -4x + 5, you can identify a, b, and c as a=1, b=-4, and c=5 and then follow the two step process as follows:
Step A: Use the formula x=-b/2a to find the x-coordinate value of the vertex point.
Since b=-4 and a=1, x=-b/2a → x= -(-4) / 2(1) → x =4/2 → x = 2
Step B: Input the x-coordinate value from Step A into the function to find the y-coordinate value.
Now that you know that the x-coordinate value for the vertex is x=2, you can input x=2 into the function to find the value of the y-coordinate as follows:
f(x)=x^2 -4x + 5 → f(2) = (2)^2 -4(2) + 5 → f(2) = 4 - 8 + 5 = 1 → y=1

Figure 03: What is the vertex of a parabola with equation f(x)=x^2 -4x + 5
So, the coordinates of the vertex point of the parabola that represents the quadratic function f(x)=x^2 -4x + 5 is (2,1).
The graph of this function, including the vertex point, is shown on the coordinate plane in Figure 03.
Now that you know how to find the vertex point of a parabola, you are ready to work through a few step-by-step examples of how to graph a parabola on the coordinate plane using 3-easy steps (the first of which is to identify what is the vertex of the parabola).
If you need more practice finding the vertex of a parabola, check out our free step-by-step guide to finding the vertex of a parabola before moving forward.
How to Graph a Parabola: Example #1
Graph: f(x)= x^2 + 6x + 5
Now you are ready to start graphing a parabola on the coordinate plane using a simple three-step method:
Step 1: Find the coordinates of the vertex point
Step 2: Create a function table and “build” two points on each side of the vertex
Step 3: Plot your points and construct your curve (parabola)
Now, let’s go ahead and apply these three steps to this first example:
Step 1: Find the coordinates of the vertex point
To find the coordinates of the vertex point of the quadratic function f(x)= x^2 + 6x + 5, we will use the same process shown in Figure 02 above as follows:
Step A: Use the formula x=-b/2a to find the x-coordinate value of the vertex point.
Since b=6 and a=1, x=-b/2a → x= -6 / 2(1) → x =-6/2 → x = -3
Step B: Input the x-coordinate value from Step A into the function to find the y-coordinate value.
Now that you know that the x-coordinate value for the vertex is x=-3, you can input x=-3 into the function to find the value of the y-coordinate as follows:
f(x)=x^2 + 6x + 5 → f(-3) = (-3)^2 -6(-3) + 5 → f(2) = 4 - 8 + 5 = -4 → y=-4
So, the coordinates of the vertex point of the parabola are (-3,-4)

How to Graph a Parabola: Use a function table.
Step 2: Create a function table and “build” two points on each side of the vertex
Once you figure out the coordinates of the vertex point, you can build a function table like the one shown in Figure 04. Your function table should include a x-coordinate column and a y-coordinate column and rows for at least five points on the graph.
Since the vertex represents the “turning point” if a U-shaped parabola, the vertex coordinates should be placed in the middle of your function table.
Next, it’s time to “build “ points on each side of the vertex point by inputting x-values that are both less than -3 and greater than 3 into the original function and outputting the values.
Again, since the x-coordinate of the vertex point is -3, we will choose two x-values that are less than -3 (-4 and -5 in this example) and two x-values that are greater than -3 (-2 and -1 in this example).
Then, take each x value and input it into the function to find the corresponding y-value. For example, to find the y-coordinate value when x=-5, simply evaluate for f(-5) as shown in Figure 04 below.
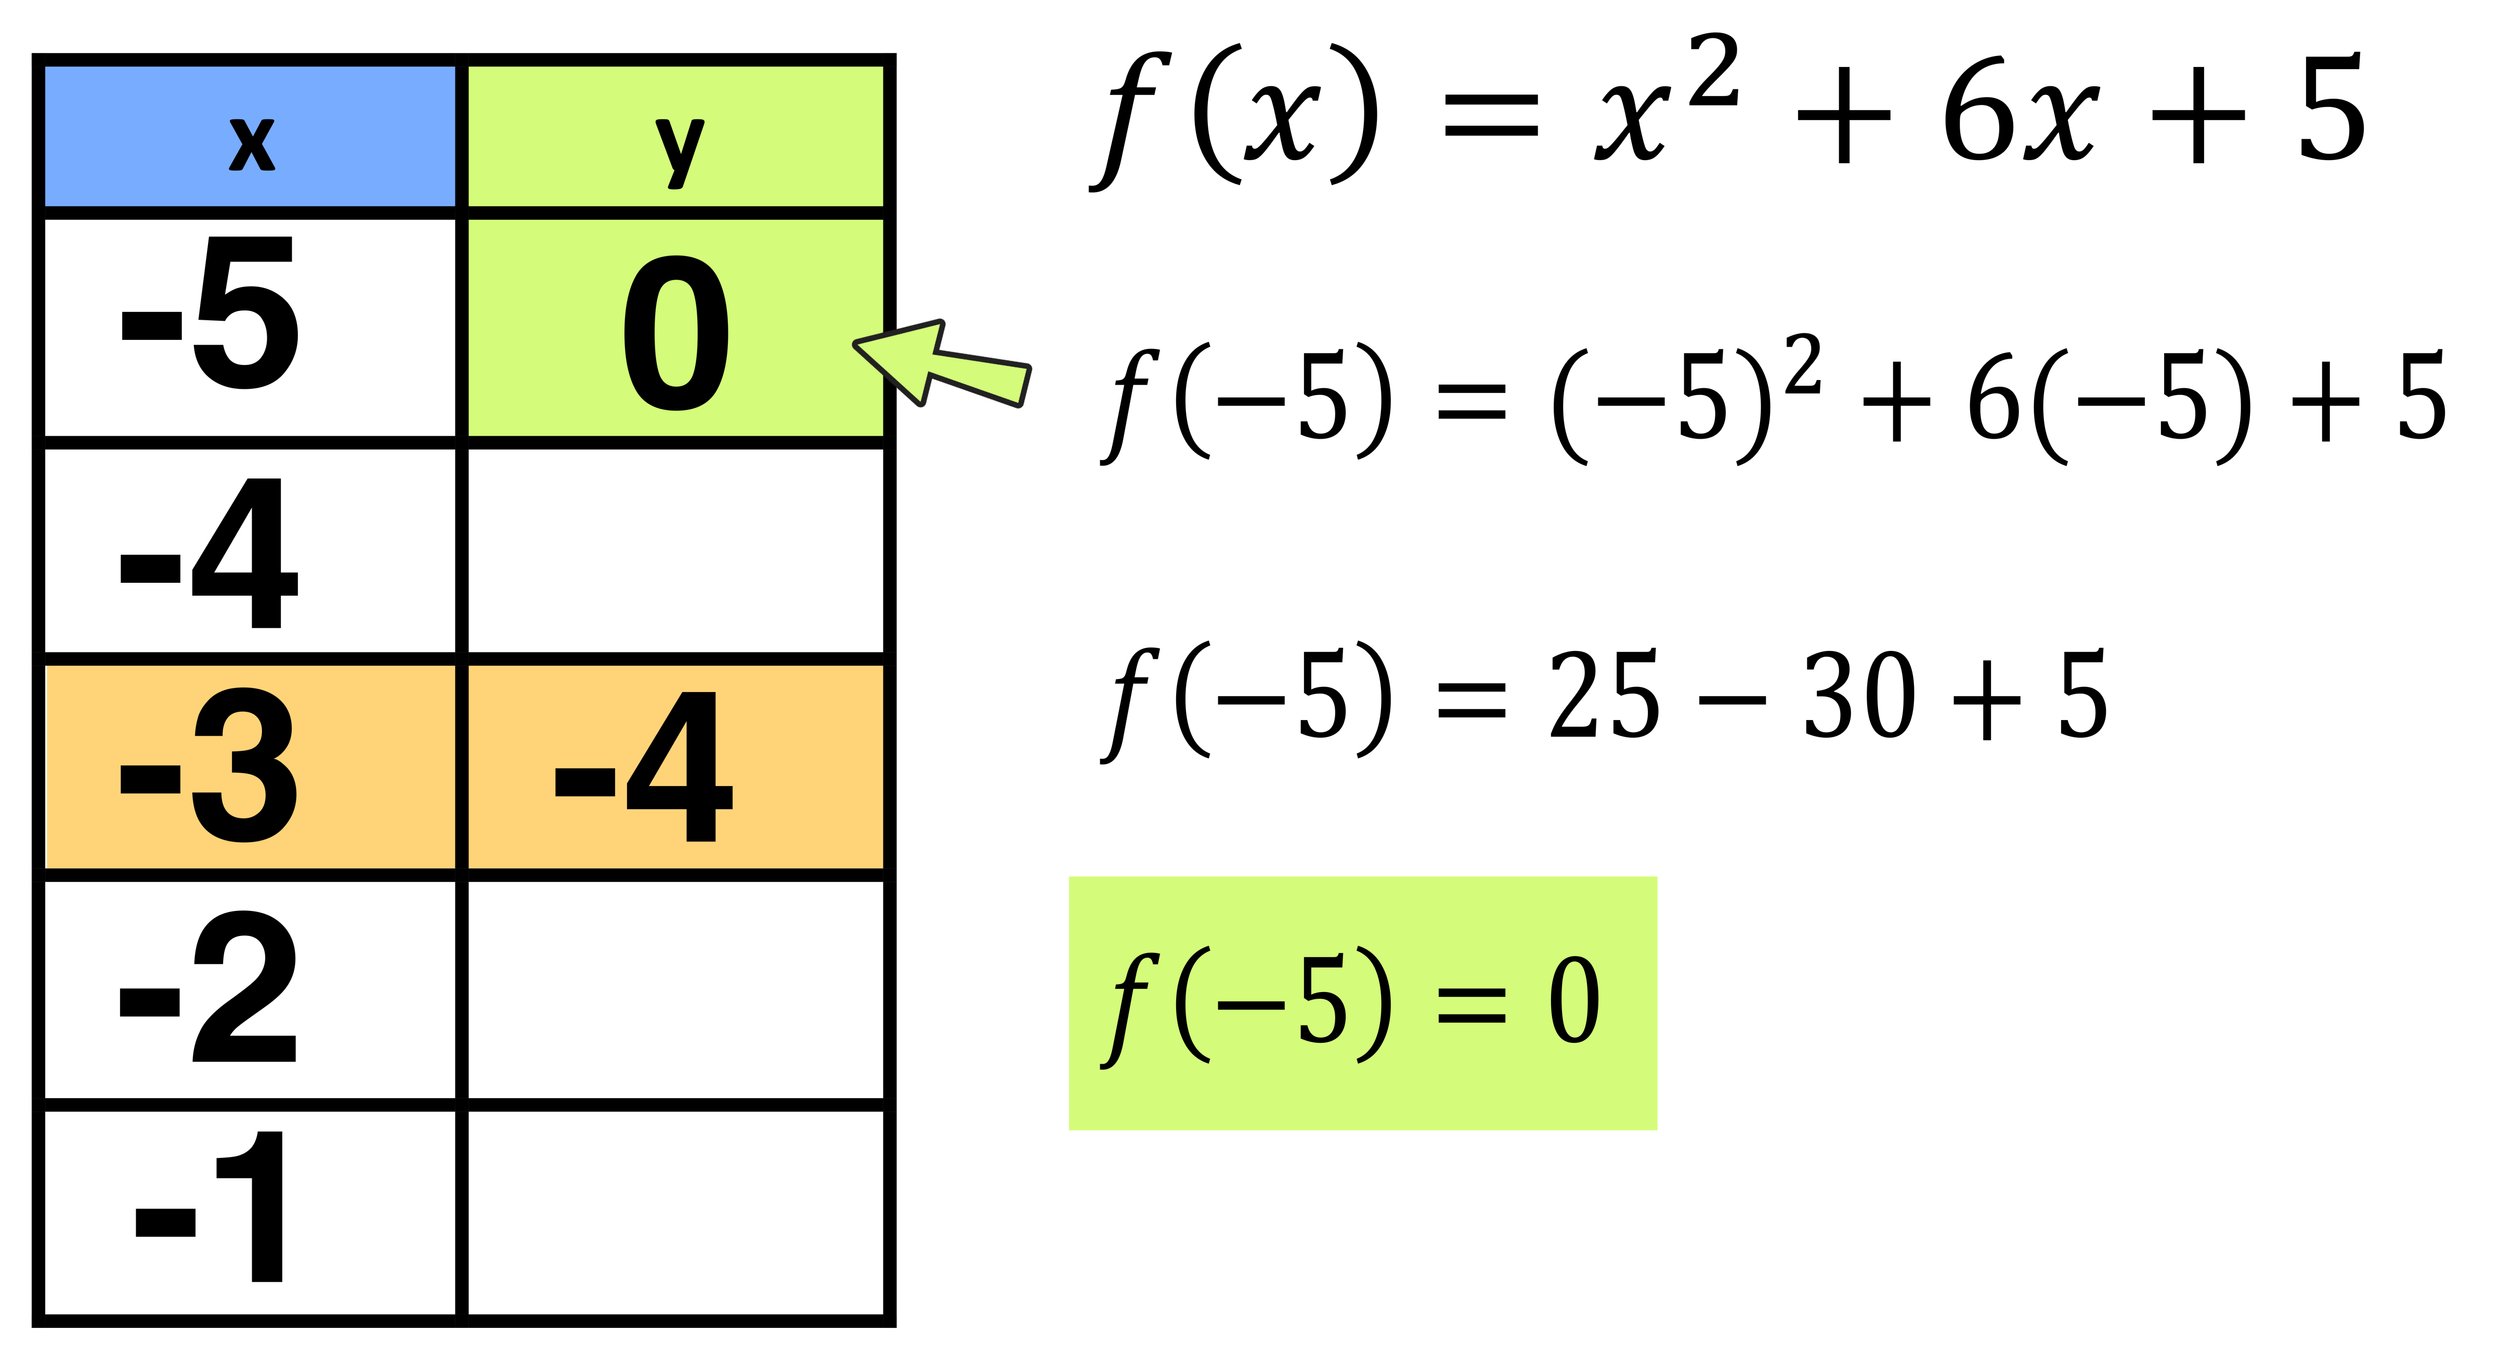
Figure 04: Graphing a parabola using a function table and building points around the vertex.
Since f(-5)=(-5)^2+6(-5)+5 = 0, you can conclude that, when x is -5, y is 0 (and that (-5,0) is a point on the parabola. Now, go ahead and repeat this process to find f(-4), f(-2), and f(-1) to complete your function table as shown in Figure 05 below.

Figure 05: Completed function table
Step 3: Plot your points and construct your curve (parabola)
The third and final step is to plot all five points on your function table on the coordinate plane. You should notice that the points follow a symmetrical U-shape with a turning point about the vertex point, which is (-3,-4) in this example.
Note that the points on the completed function table are (-5,0), (-4,-3), (-3,-4), (-2,-3), and (-1,0). After plotting these five points on the coordinate plane, you should have a graph resembling Figure 06 below.

Figure 06: How to graph a parabola: plot all of the points from your function table.
Once your points have been plotted, you are ready to construct your parabola by drawing a U-shaped curve that passes through all five points as shown in Figure 07 below.
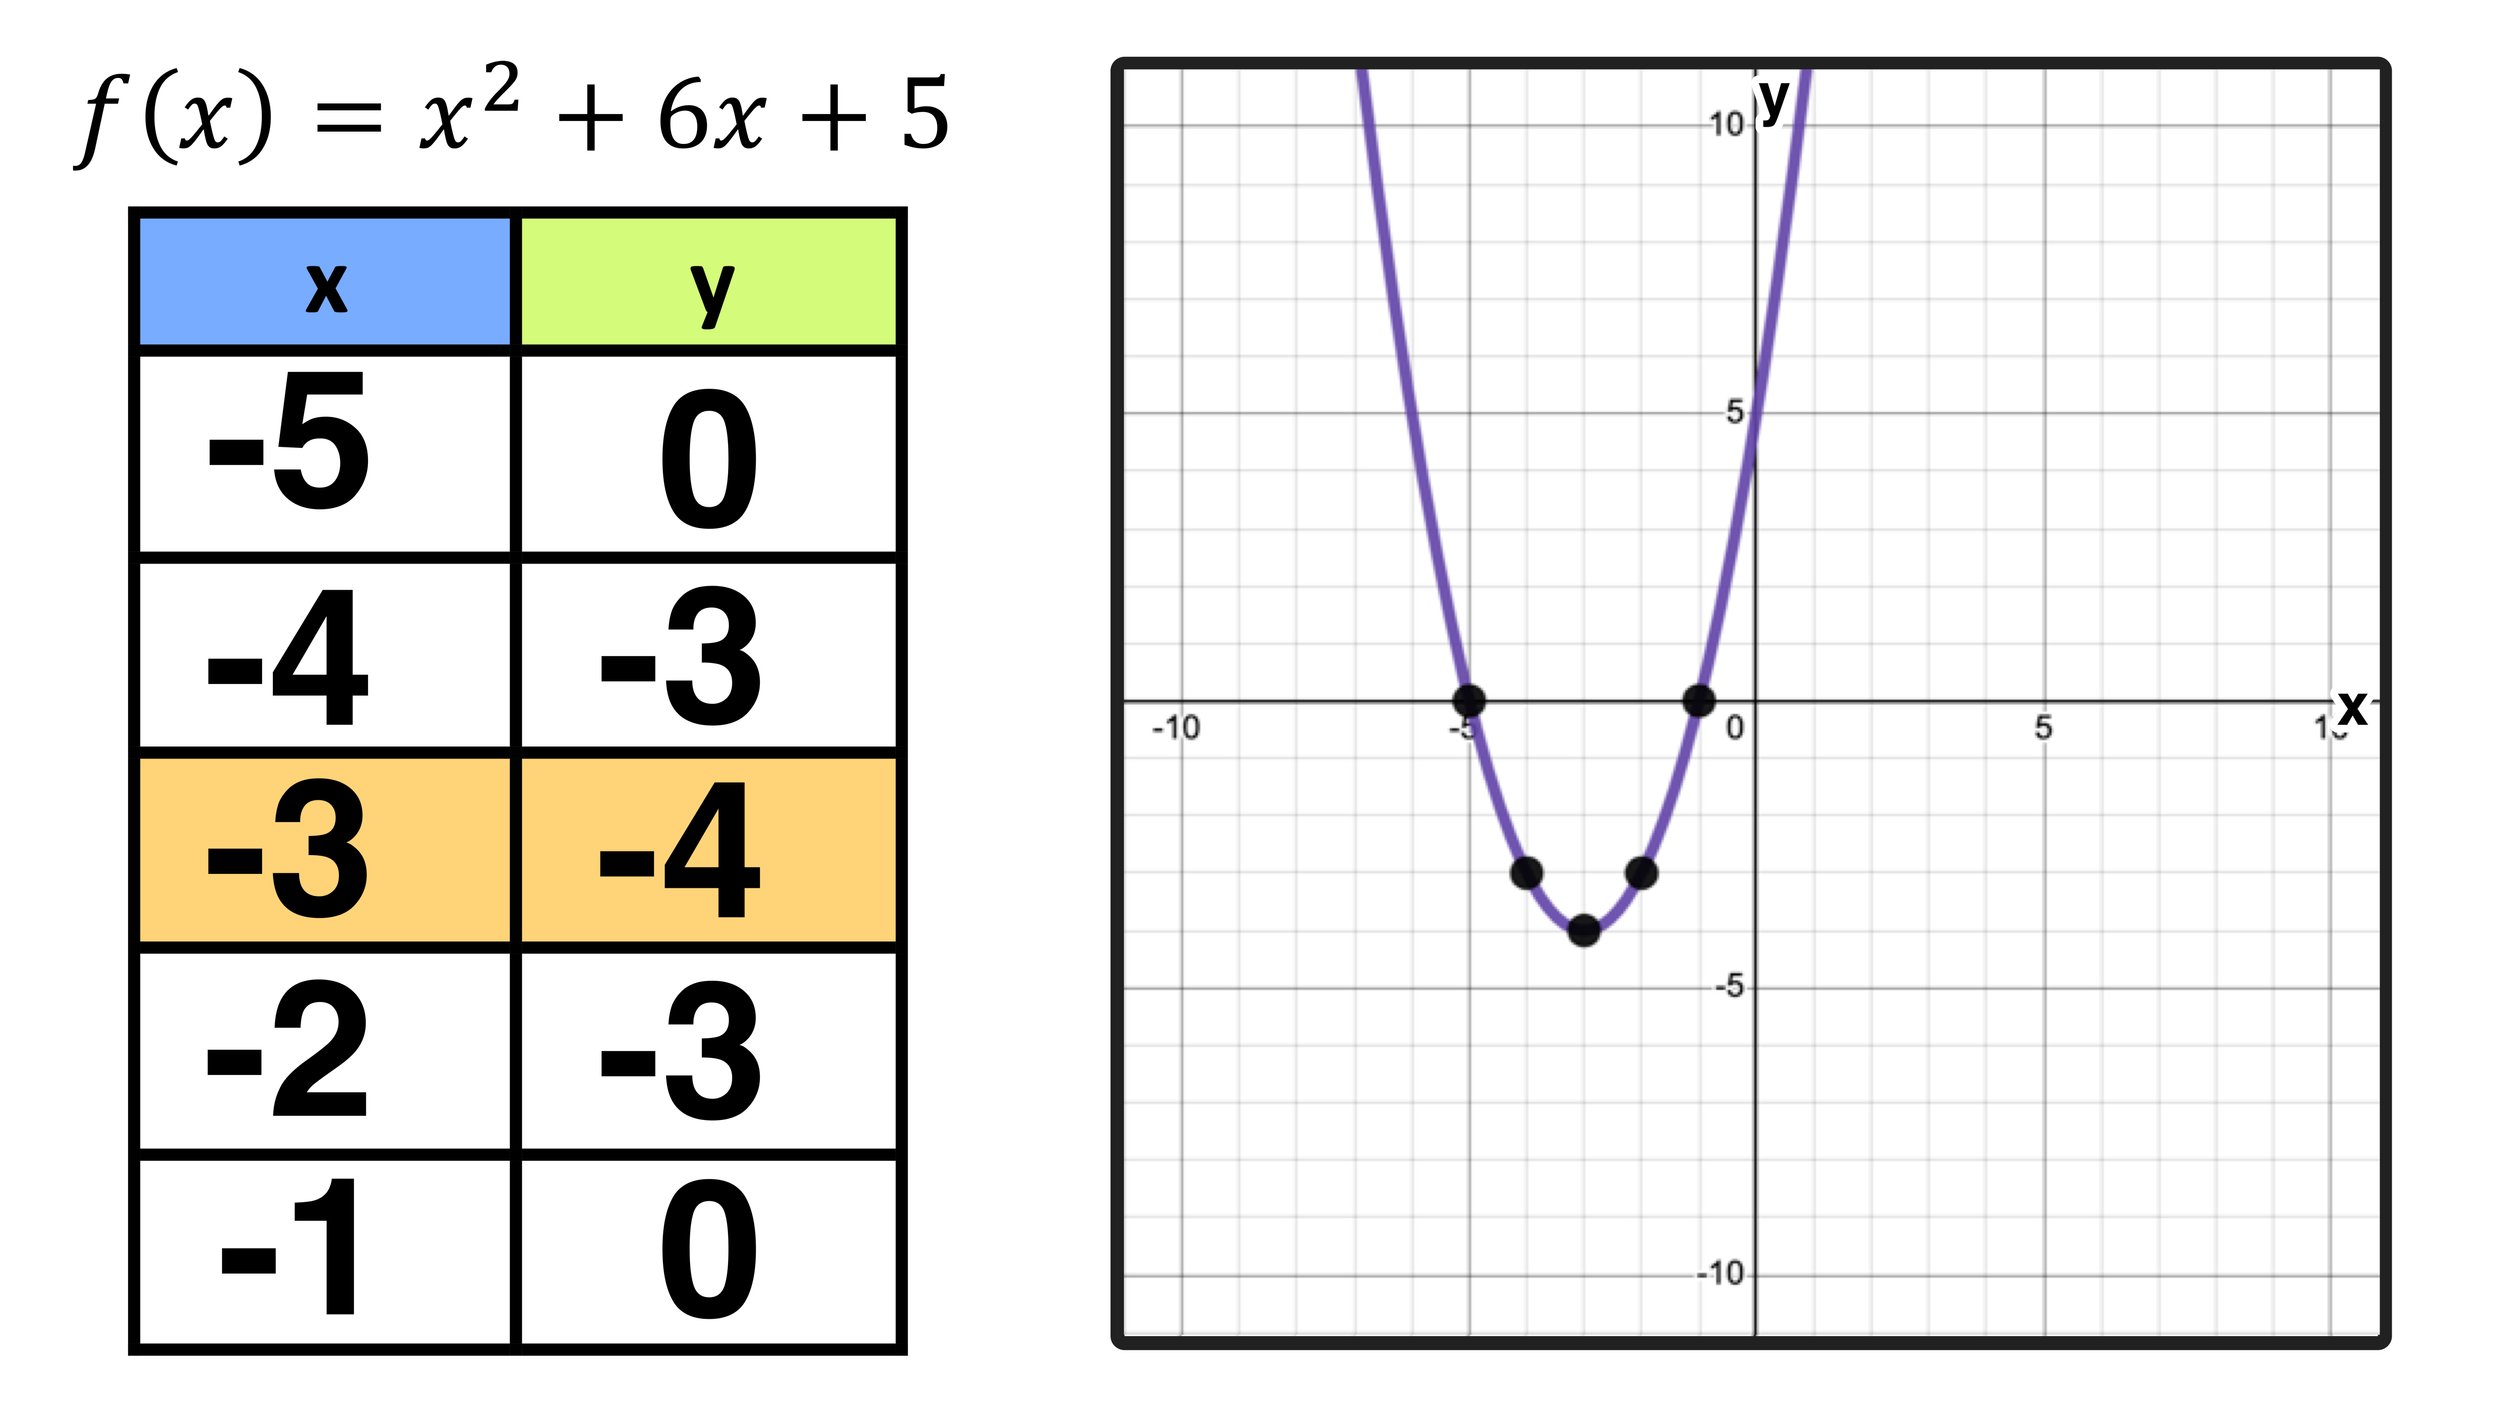
Figure 07: The graph of the parabola that represents the function f(x)=x^2+6x+5
How to Graph a Parabola: Example #2
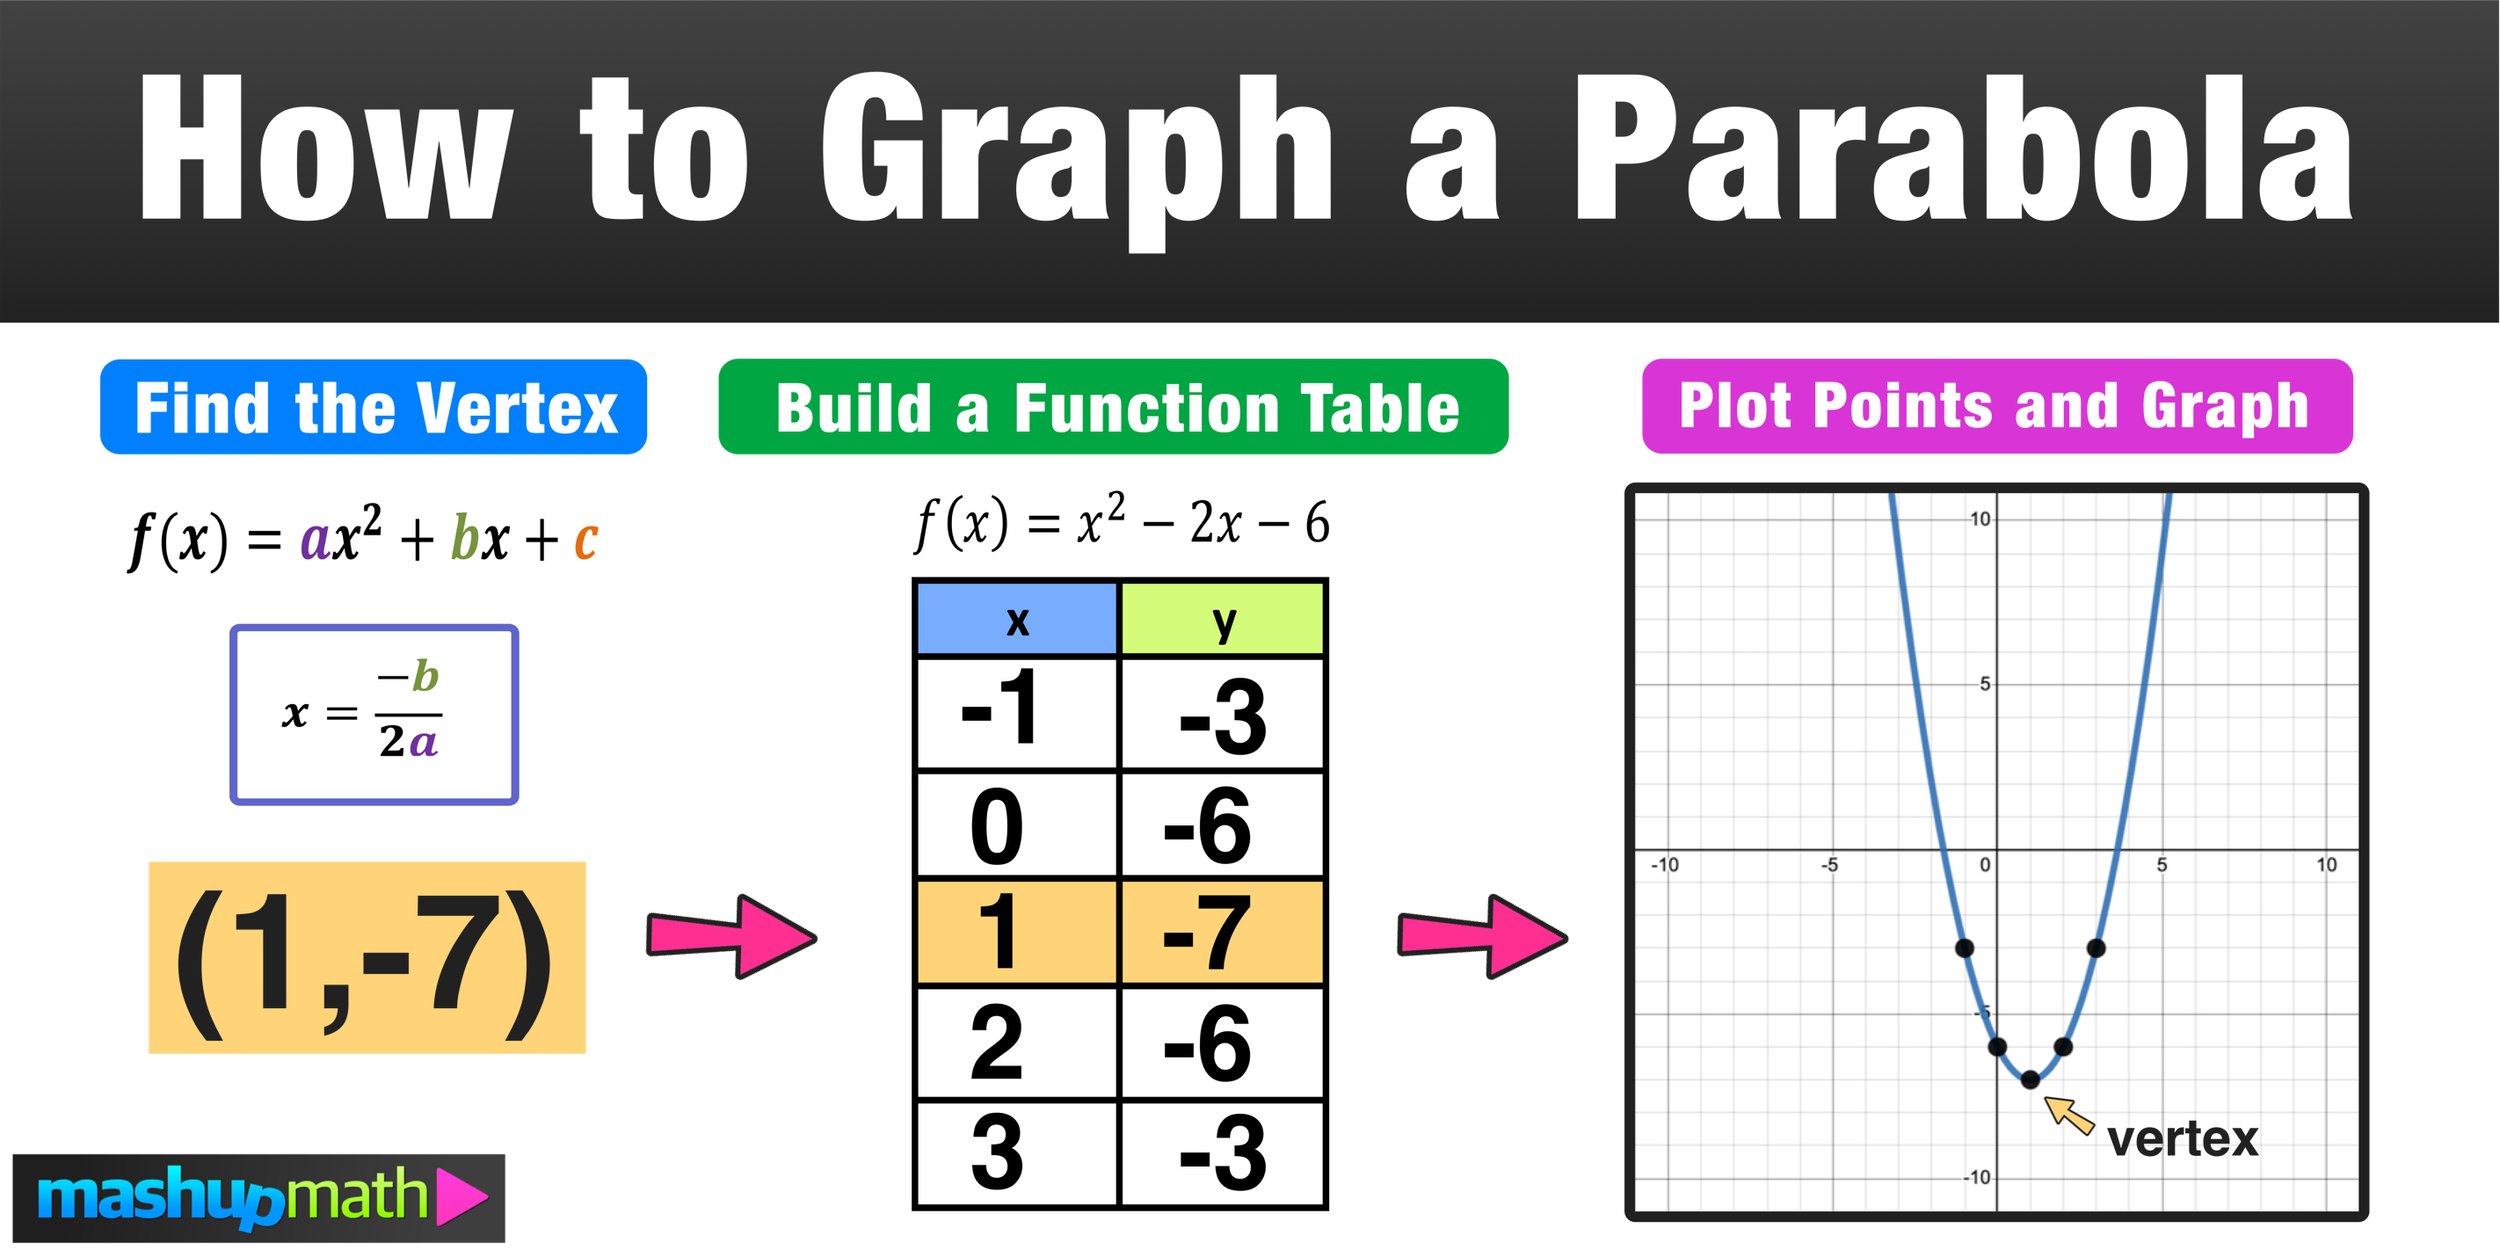
Graph: f(x)= x^2 - 2x - 6
Let’s working through this next example of graphing a parabola using the same 3-step method:
Step 1: Find the coordinates of the vertex point
You can find the coordinates of the vertex point of x^2 - 2x - 6 as follows:
Step A: Use the formula x=-b/2a to find the x-coordinate value of the vertex point.
Since b=-2 and a=1, x=-b/2a → x= -(-2) / 2(1) → x =2/2 → x = 1
Step B: Input the x-coordinate value from Step A into the function to find the y-coordinate value.
Now that you know that the x-coordinate value for the vertex is x=1, you can input x=1 into the function to find the value of the y-coordinate as follows:
f(x)=x^2 - 2x - 6→ f(1) = (1)^2 -2(1) -6 → f(1) = 1- 2 -6 = -7 → y=-7
So, the coordinates of the vertex point of the parabola are (1,-7)
Step 2: Create a function table and “build” two points on each side of the vertex
Now that you know the coordinates of the vertex point are (1,-7), you can start building points on each side of the vertex point by inputting x-values that are both less than 1 (0 and -1 in this example) and greater than 1 (2 and 3 in this example) into the original function and outputting the y-coordinate values.
For example, for x=0, you can find the y-value as follows:
f(0)=(0)^2-2(0)-6 = 0-0-6 = -6
So, you can conclude that, when x is 0, y is -6 (and that (-6,0) is a point on the parabola. Figure 08 below shows how to calculate f(0) as well as all of the other points on the data table.

Figure 08: Completed data table
Step 3: Plot your points and construct your curve (parabola)
Once you have completed your data table, you are ready to plot all five of the following points on the coordinate plane: (-1,-3), (0,-6), (1,-7), (2,-6), and (3,-3).
After plotting all of the points, your graph should resemble Figure 09 below:
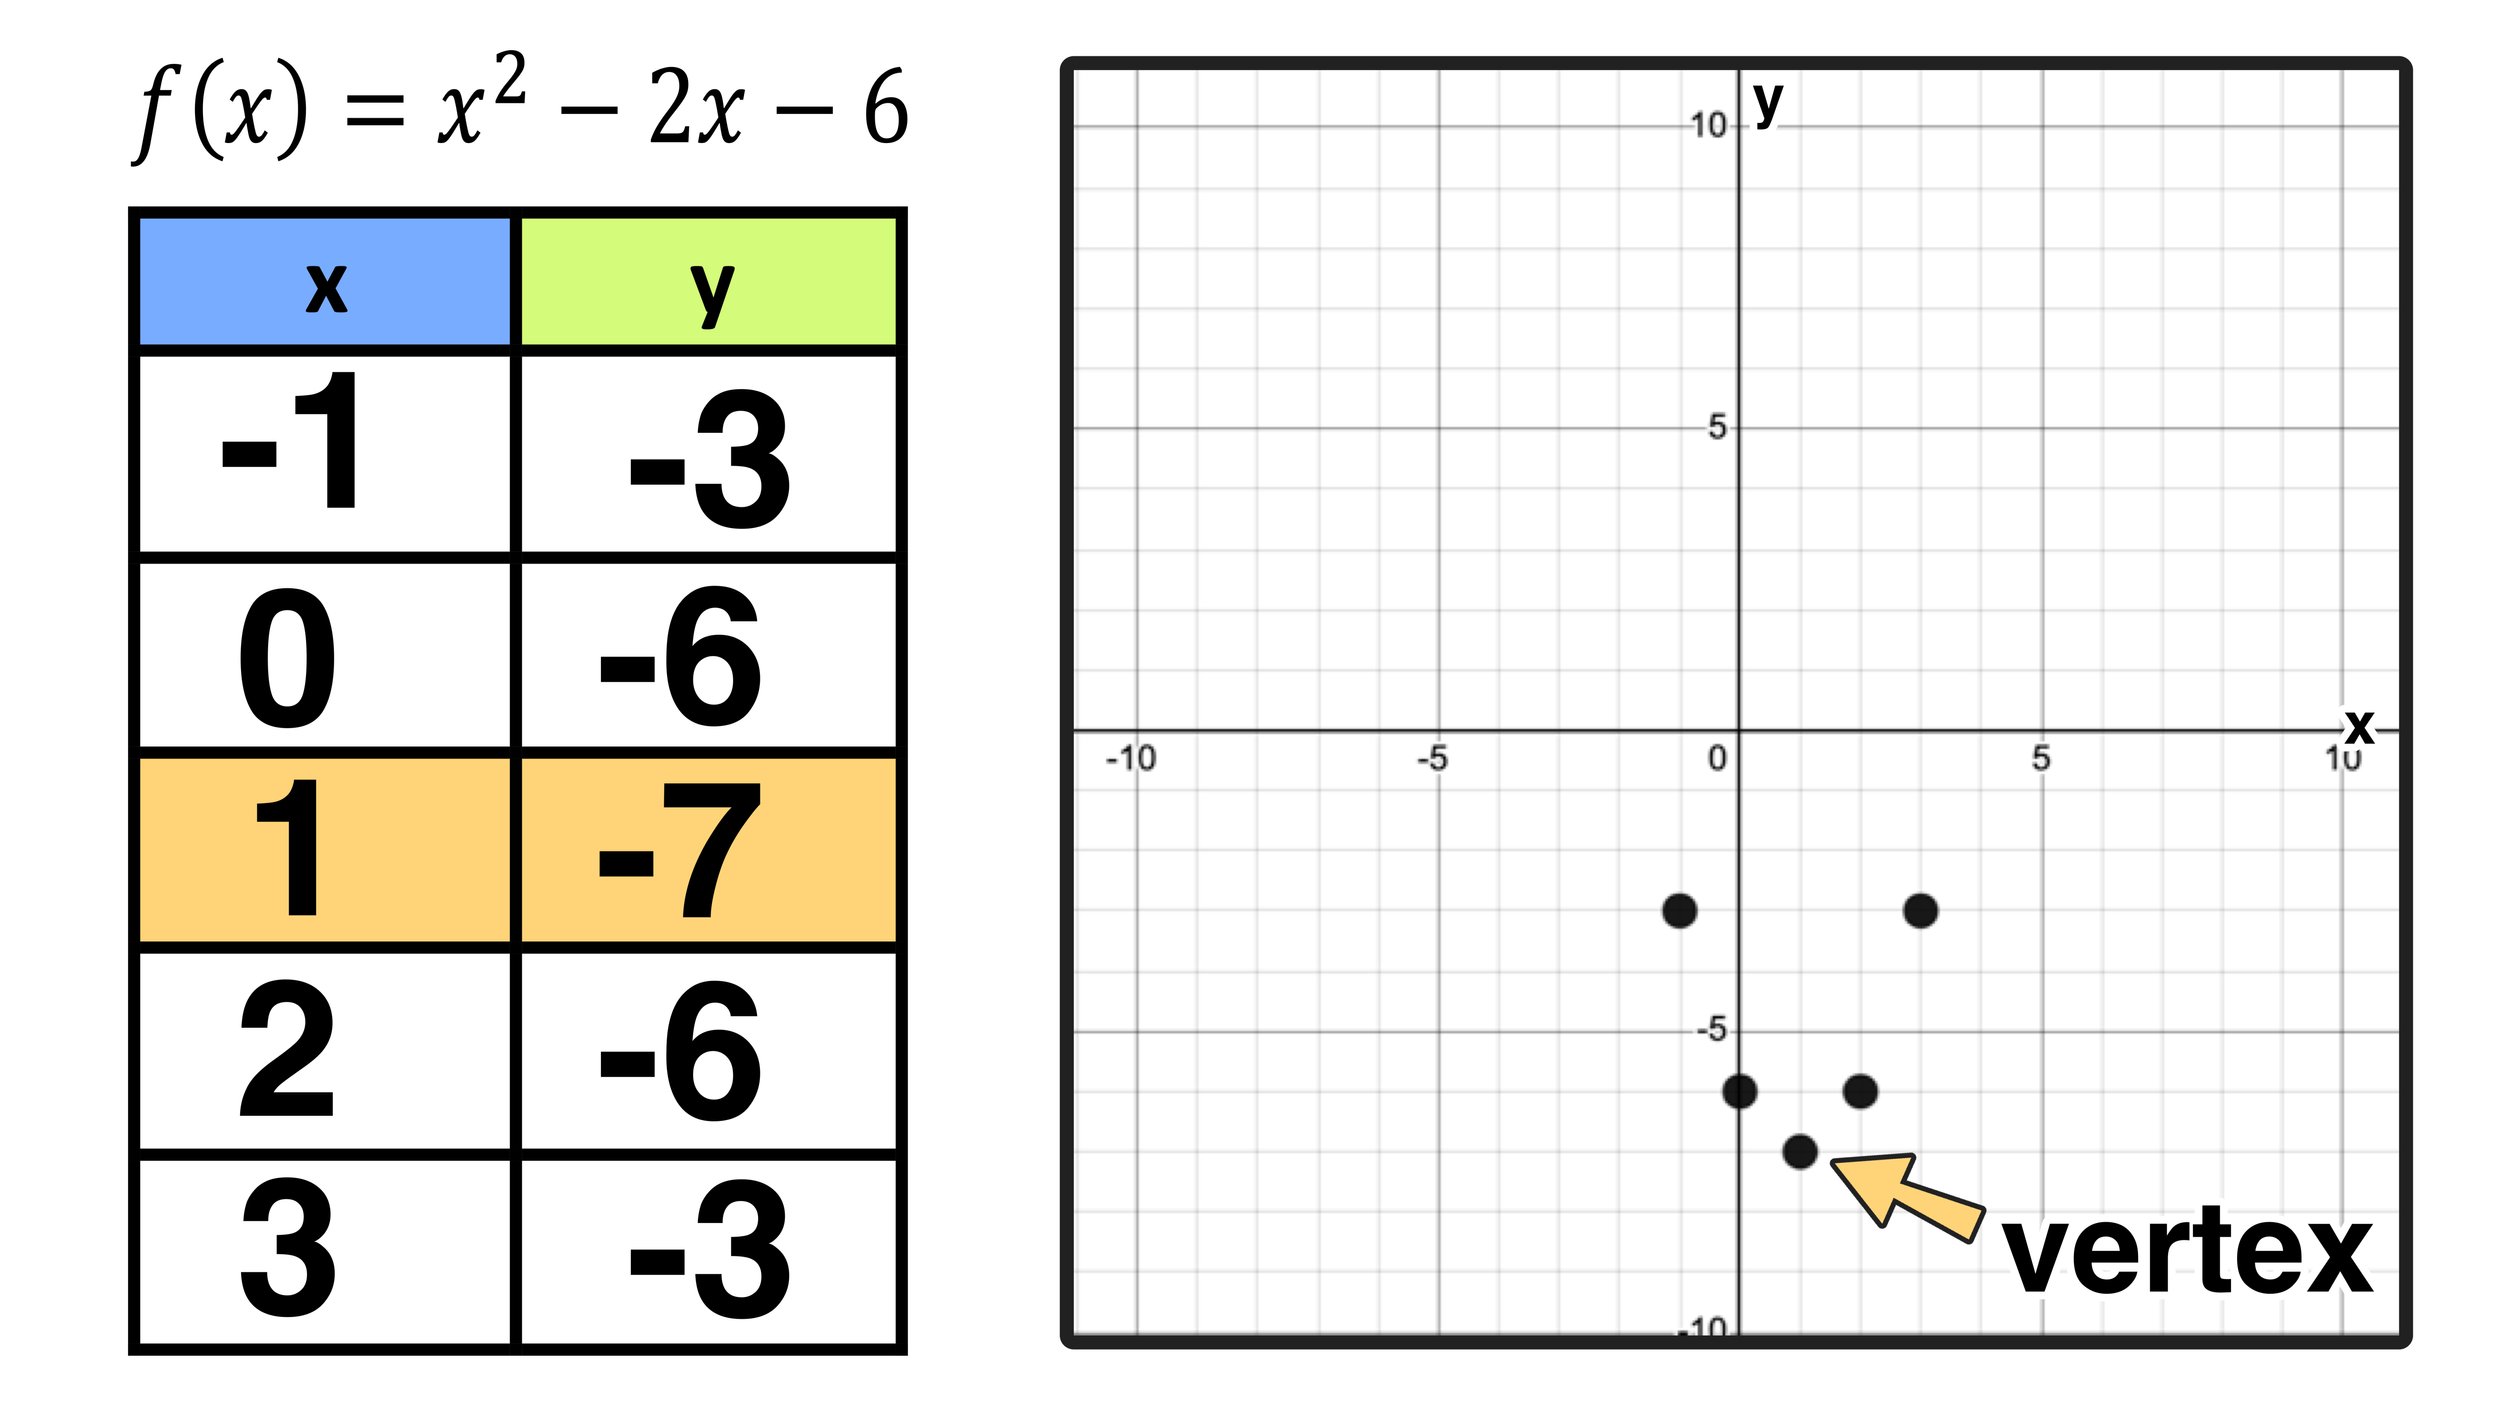
Figure 09: Notice that the vertex point is a “turning point”
Finally, draw your curve that passes through the point to finish graphing a parabola that represents the function f(x)=x^2-2x-6 as shown in Figure 10 below:

Figure 10: How to Graph a Parabola in Standard Form Example #2 Completed
How to Graph a Parabola: Example #3
Graph: f(x)= -x^2 +8x - 12
Let’s graph a parabola one last time in this final example (notice that the value of a is -1 in this example).
Step 1: Find the coordinates of the vertex point
You can find the coordinates of the vertex point of f(x)= -x^2 +8x - 12 as follows:
Step A: Use the formula x=-b/2a to find the x-coordinate value of the vertex point.
Since b=8 and a=-1, x=-b/2a → x= -(8) / 2(-1) → x =-8/-2 → x = 4
Step B: Input the x-coordinate value from Step A into the function to find the y-coordinate value.
Now that you know that the x-coordinate value for the vertex is x=4, you can input x=4 into the function to find the value of the y-coordinate as follows:
f(x)=-x^2 +8x - 12→ f(4) = -(4)^2 +8(4) -12 → f(4) = -16 + 32 - 12 → y=4
So, the coordinates of the vertex point of the parabola are (4,4)
Step 2: Create a function table and “build” two points on each side of the vertex
Next, use the vertex point of (4,4) to build points on each side of the vertex by inputting x-values that are both less than 4 (3 and 2 in this example) and greater than 4 (5 and 6 in this example) into the original function and outputting the y-coordinate values.
For example, for x=5, you can find the y-value as follows:
f(5)=-(5)^2+8(5)-12 = -25 + 40 - 12 = 3
So, you can conclude that, when x is 5, y is 3 (and that (5,3) is a point on the parabola. Figure 11 below shows how to calculate f(5) as well as all of the other points on the data table.
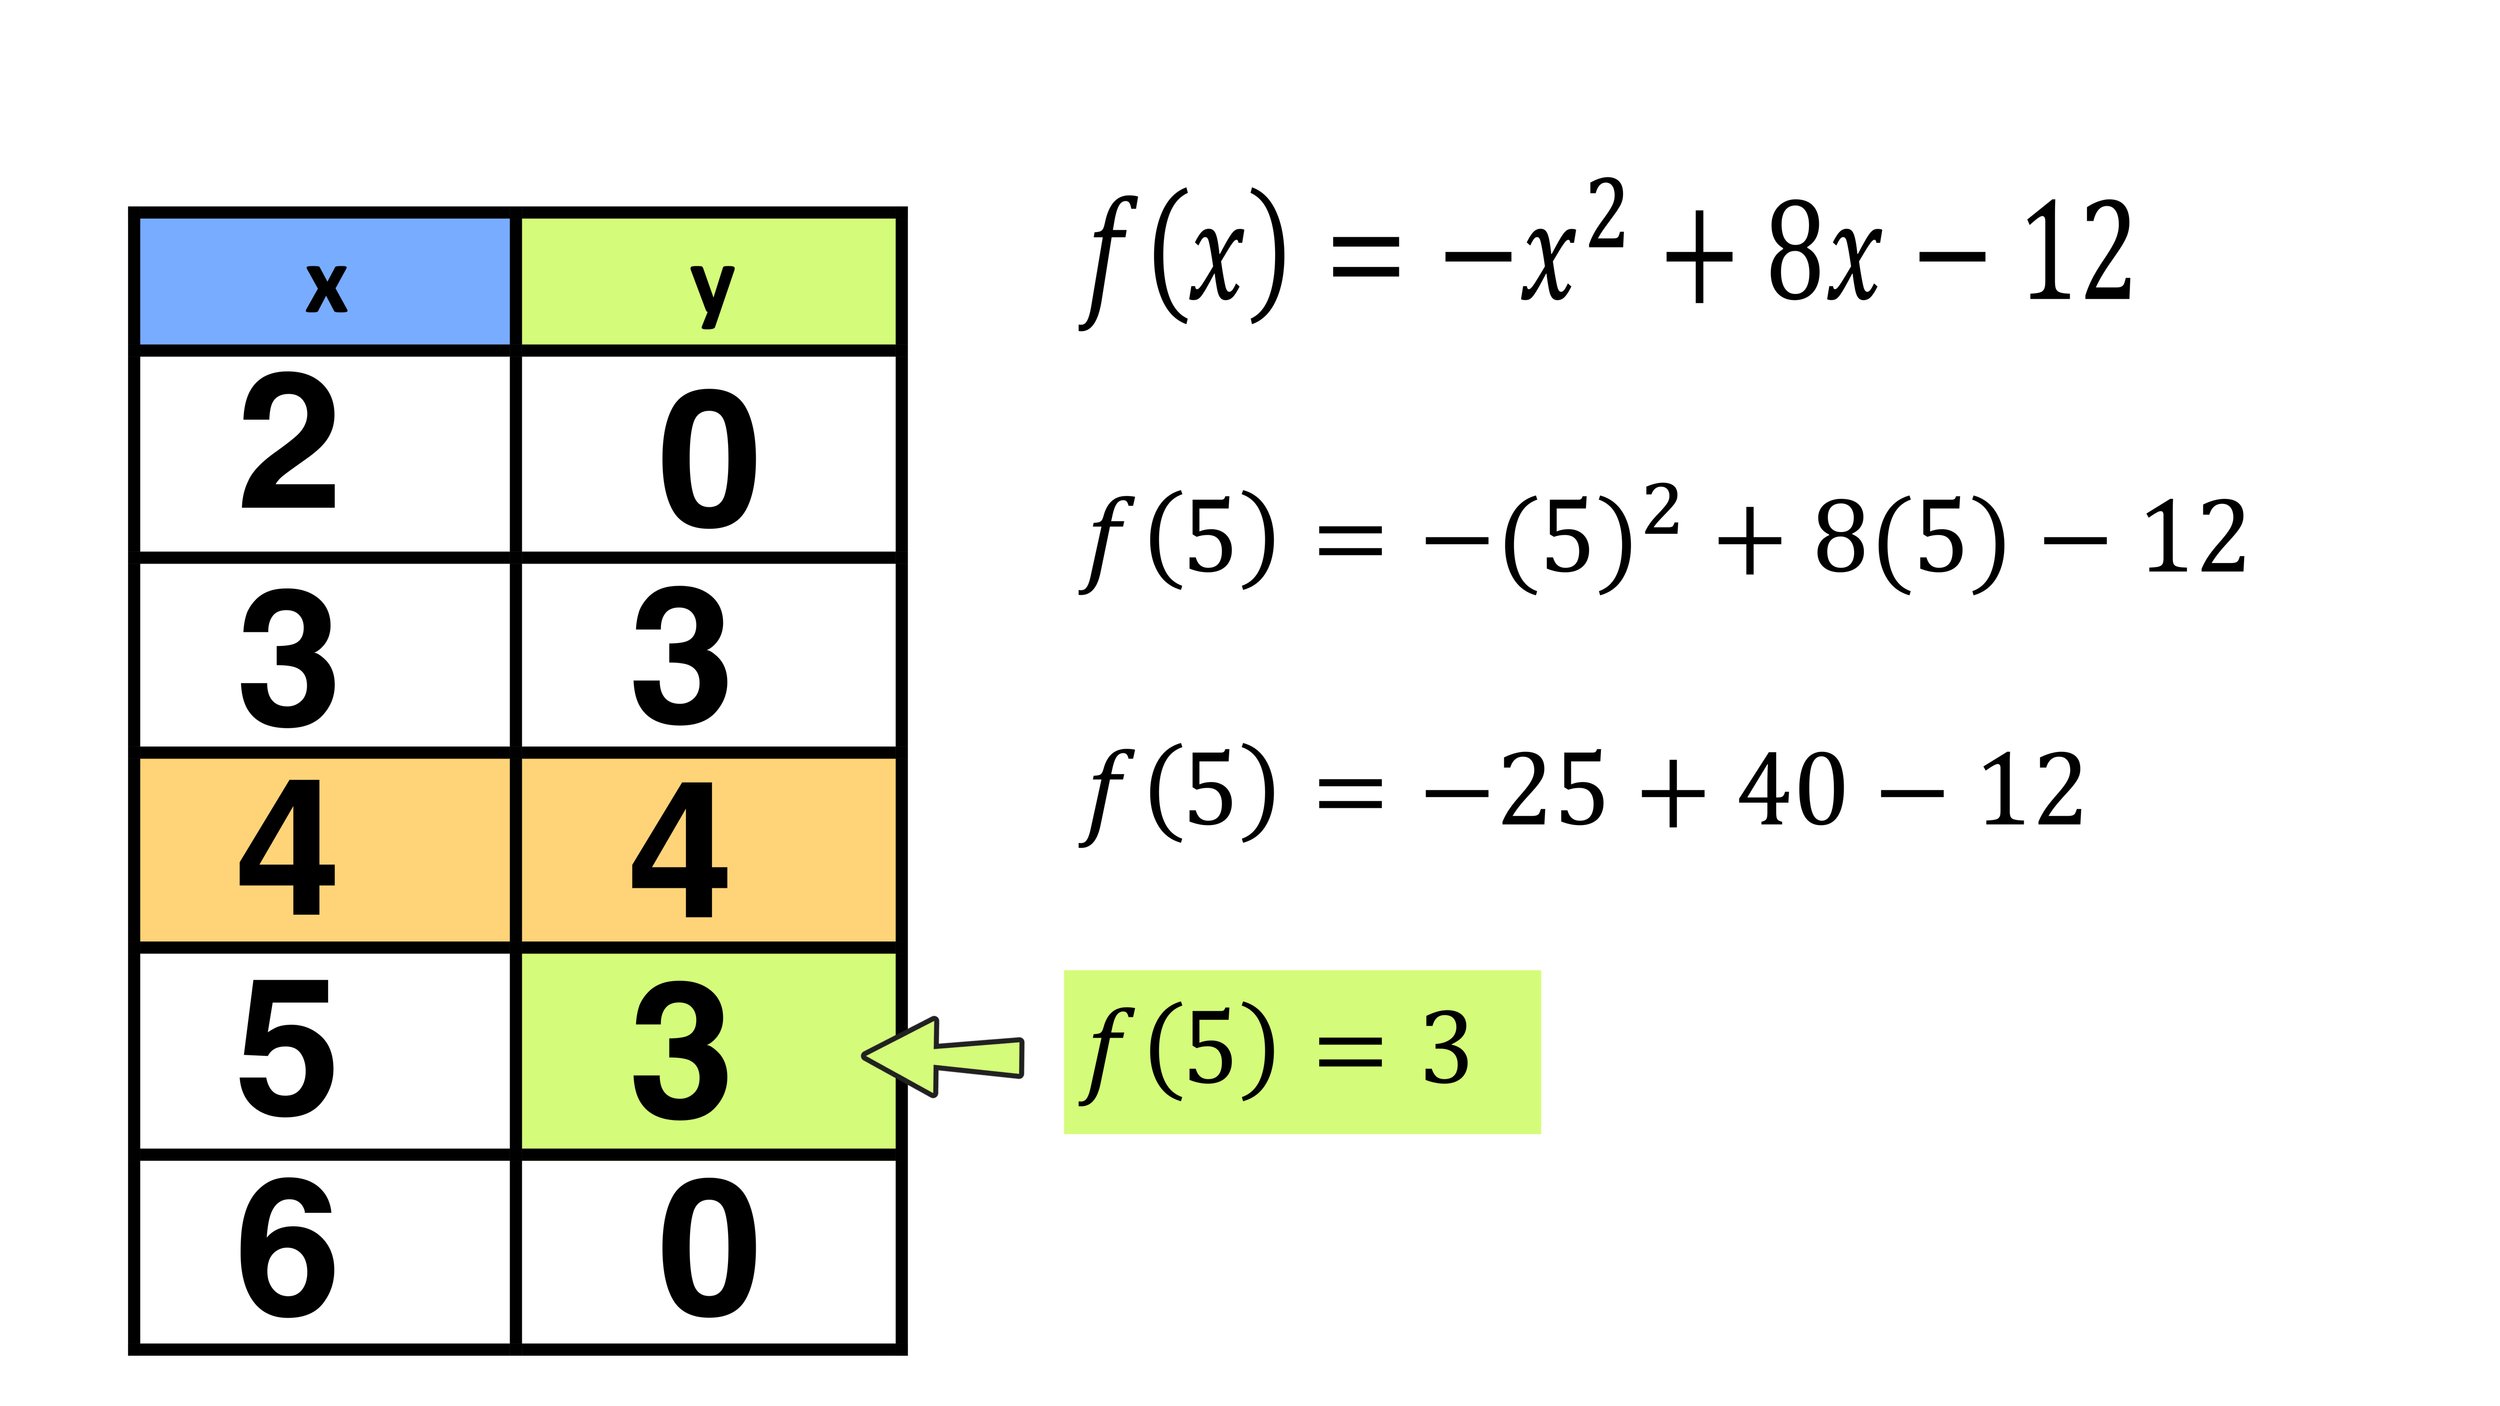
Figure 11: Completed function chart
Step 3: Plot your points and construct your curve (parabola)
Now you are ready to plot the points (2,0), (3,3), (4,4), (5,3), and (6,0) on the coordinate plane as shown in Figure 12 below:

Figure 12
Notice how the parabola in Example #3 appears to be opening downward (while the parabolas in examples 1 and 2 are opening upwards). This is totally fine, as parabolas can open upwards or downwards.
The last step is to draw your curve that passes through the points to finish graphing the parabola that represents as shown in Figure 13 below:

Figure 13: How to Graph a Parabola Example #3 - The parabola opens downward.
How to Graph a Parabola in Standard Form: Conclusion
Any quadratic in standard form f(x)=ax^2+bx+c will have a graph in the shape of a parabola—a U-shaped curved that is symmetrical about a vertex point. Parabolas can open upwards or downwards. Graphing a parabola that represents a quadratic function can be done by following a 3-step method:
Step 1: Find the coordinates of the vertex point
Step 2: Create a function table and “build” two points on each side of the vertex
Step 3: Plot your points and construct your curve (parabola)
Keep Learning:
More Math Resources You Will Love: