How to Graph a Circle in 3 Easy Steps
Your complete guide to graphing a circle from an equation

Guide Preview: How to graph a circle in 3 steps.
Understanding how to graph a circle from an equation on the coordinate plane is an important and useful skill that every algebra student must learn.
This step-by-step guide will teach you a simple three step method for how to graph a circle on the coordinate plane.
Table of Contents:
While learning how to graph a circle on the coordinate plane may seem challenging, it’s actually a relatively straightforward skill that you can learn with practice. Since the process of graphing a circle from an equation involves simply plugging in some values into the circle equation formula, it’s important that you have a strong understanding of the formula and what it means.
So, whenever you are ready, let’s start off by learning about the Equation of a Circle, and then we will move onto working through a few practice problems of how to graph a circle on the coordinate plane in 3 easy steps.
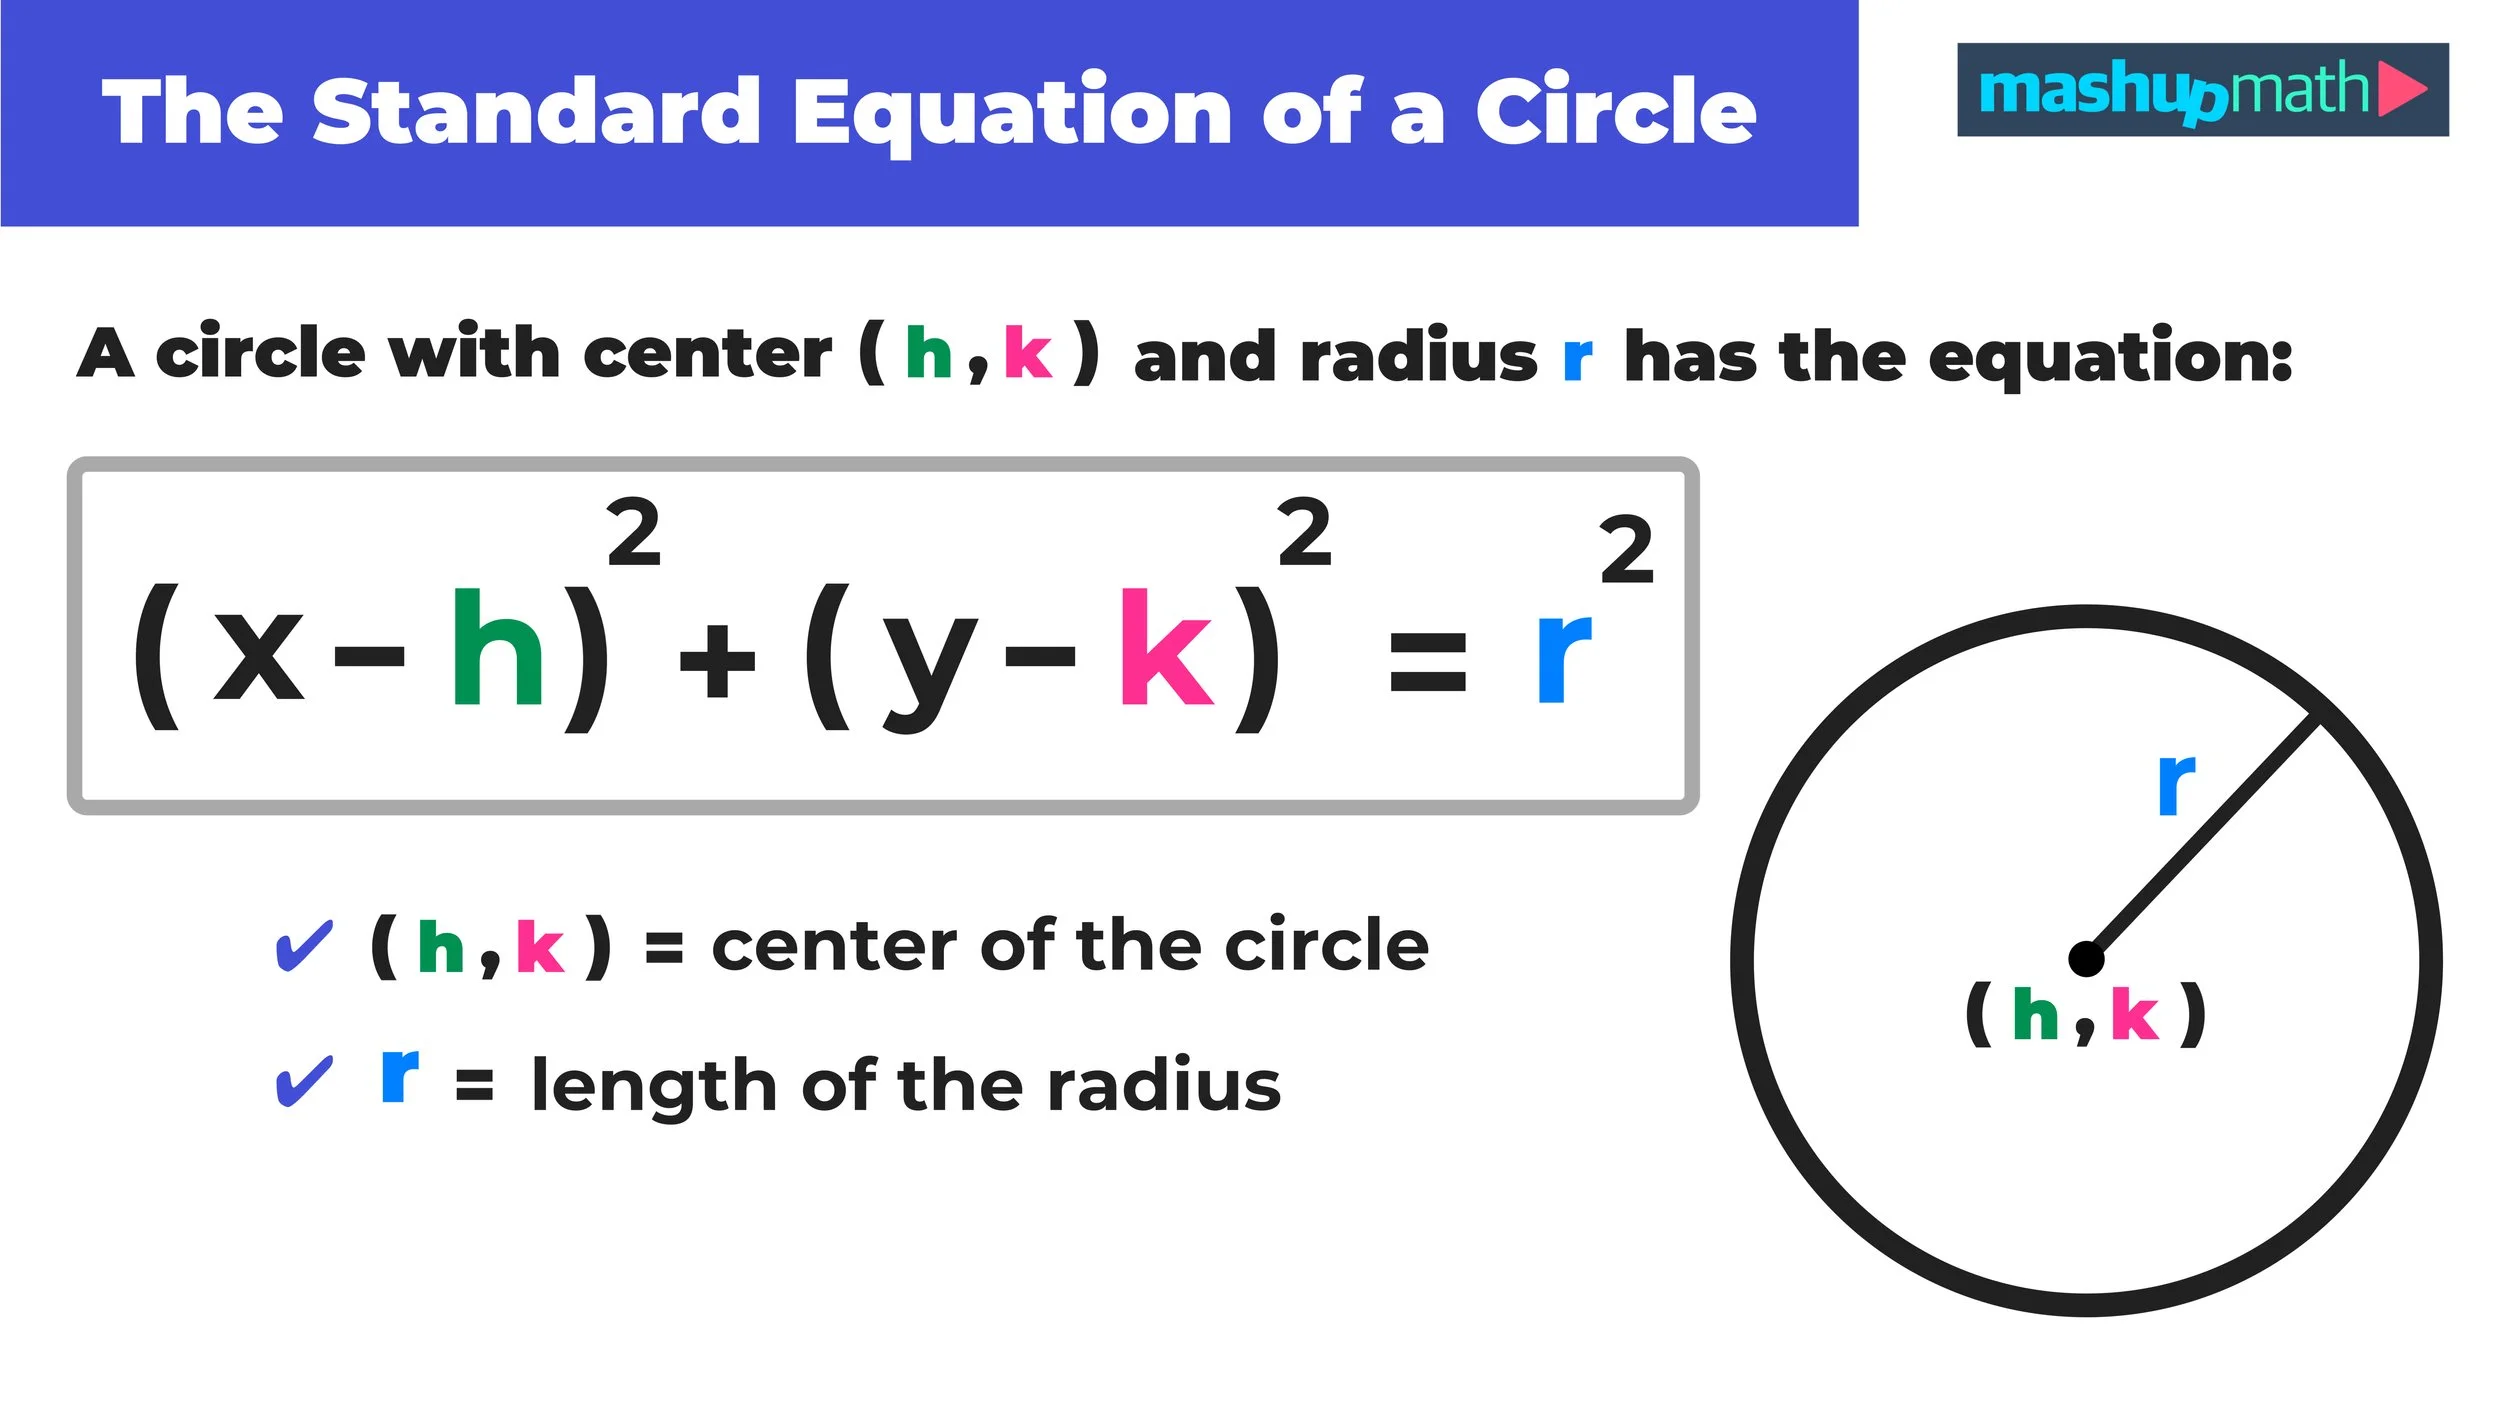
Figure 01: The standard equation of a circle.
What is the Standard Equation of a Circle?
In order to express the equation of a circle on the coordinate plane, you only need to know two things:
The coordinate points of the center point of the circle.
The length of the circle’s radius.
Standard Equation of a Circle Definition: A circle with a center at point (h,k) and a radius with length r has the equation:
(x − h)2 + (y − k)2 = r2
Where (h,k) are the coordinate points of the circle and r is the length of the radius (i.e. the distance from the center of the circle to any point on the circle itself.)
Figure 01 above illustrates the standard equation of a circle.
So, as long as you know the coordinates of a circle’s center point and the length of it’s radius, then you can write the standard equation of the circle.
For example, if a circle had a center at (3,4) and a radius of 5, we can say that:
(h,k) = (3,4) where h=3 and k=4
r=5
And we can substitute these values into the standard equation of a circle formula as follows:

Figure 02: What is the standard equation of a circle with a center at (3,4) and a radius of 5?
(x-h)² + (y-k)² = r²
(x-3)² + (y-4)² = 5²
(x-3)² + (y-4)² = 25
So, we can conclude that a circle with a center at (3,4) and a radius of 5 has the equation:
Final Answer: (x-3)² + (y-4)² = 25 (as shown in Figure 02 above).
But, how would we graph this circle on the coordinate plane? Now that you understand the standard equation of a circle, it’s time to learn how to graph a circle on the coordinate plane in 3 easy steps.
How to Graph a Circle in 3 Easy Steps
As long as you understand the standard equation of a circle, you can graph any circle on the coordinate plane by following these three steps":
Step 1: Given the equation of the circle in (x-h)² + (y-k)² = r² form, identify the coordinates of the center point (h,k) and take the square root of the constant to find r.
Step 2: Plot the center point and then use the radius to plot four additional points.
Step 3: Draw the circle.
For example, let’s graph the circle with equation (x-3)² + (y-4)² = 25 from the previous example.

Figure 03: How to graph a circle in 3 steps.
How to Graph a Circle Example #1
Problem: Graph (x-3)² + (y-4)² = 25 on the coordinate plane.
We can graph the equation of a circle represented by (x-3)² + (y-4)² = 25 by following our three steps as follows:
Step 1: Identify the coordinates of the center point (h,k) and take the square root of the constant to find r.
For this circle, h=3 and k=4, so the circle has a center at (3,4)
The constant is 25, so √25 = 5, therefore r=5
Step 2: Now that we know that center point and the length of the radius (r), we can plot the point (3,4) on the coordinate plane and that plot four points on the circle by using the radius r=5 to plot four points that are 5 units above the center, 5 units below the center, 5 units to the right of the center, and 5 units to the left of the center.
For this example, the fours points on the circle would be:
(3,9), (8,4), (3,-1) and (-2,4)
Step 3: Graph the circle.
The complete step-by-step process for how to graph a circle with equation (x-3)² + (y-4)² = 25 is shown in Figure 03 above, and the final image after graphing a circle from an equation for Example #1 solved is shown in Figure 04 below.
Final Answer: The graph of (x-3)² + (y-4)² = 25 on the coordinate plane:

Figure 04: How to Graph a Circle: Example #1 Solved
Are you still confused about how to graph the equation of a circle? That’s okay, let’s gain some more practice by working through another example.
How to Graph a Circle Example #2
Problem: Graph (x-1)² + (y+5)² = 49 on the coordinate plane.
We can use our 3-steps to graphing a circle from an equation as follows:
Step 1: Identify the coordinates of the center and the length of the radius:
For this example, notice that the given equation is not actually in (x-h)² + (y-k)² = r² form.
The sign inside of the second term ( (y+5)² ) is +, when it actually needs to be negative, so we can rewrite it as:
(x-1)² + (y+5)² = 49 → (x-1)² + (y - (- 5))² = 49
We can do this because (y - (-5)) and (y+5) both mean the same thing, and we can conclude that:
The circle has a center at (1, -5)
If this sees confusing, it may be easier to remember that you just have to change the sign of the coordinate value whenever you are pulling it out of the circle equation.
As for the radius:
The constant is 49, so √49 = 7, therefore r=7
Step 2: Next, we can plot the point (1,-5) on the coordinate plane and then plot points that are 7 units above the center, 7 units below, 7 to the left, and 7 to the right.
For this example, the fours points on the circle would be:
(1,0), (6,-5), (1,-10) and (-4,-5)
Step 3: Graph the circle.
The graph of (x-1)² + (y+5)² = 49 is shown in Figure 05 below:
Final Answer: The graph of (x-1)² + (y+5)² = 49 on the coordinate plane:

Figure 05: Graph the Equation of a Circle Example #2 Solved
How to Graph a Circle Example #3
Problem: Graph x² + y² = 100 on the coordinate plane.
Now, let’s work through one more example of graphing a circle from a given equation using our 3-step method:
Step 1: Identify the coordinates of the center and the length of the radius:
Notice that the given equation is not in (x-h)² + (y-k)² = r² form.
However, the given equation x² + y² = 100 is actually equivalent to:
x² + y² = 100 → (x-0)² + (y - 0)² = 100
The given equation x² + y² = 100 is simplified, and since h=0 and k=0, we can say that
The circle has a center at the origin (0,0).
As for the radius:
The constant is 100, so √100 =10, therefore r=10
Step 2: For the next step, we can plot the center point at (0,0) and then use the radius to plot four additional points that are on the circle: (0,10), (10,0), (0,-10) and (-10,0).
Step 3: Finally, graph the circle on the coordinate plane.
Figure 06 below shows what the graph of x² + y² = 100 on the coordinate plane should look like.
Final Answer: The graph of x² + y² = 100 on the coordinate plane:

Figure 06: How to Graph a Circle Example #3 Solved
Graphing Circles Practice Worksheet
Do you need some more practice with the standard equation of a circle and graphing a circle from an equation on the coordinate plane?
If so, download our free Graphing Circles on the Coordinate Plane PDF worksheet, which includes a complete answer key. Go ahead and work through the practice problems on the worksheet and then compare your answers to the key on the last page. If you are able to correctly solve 80% or more of the problems, then you have a strong understanding of the topic. However, if you are struggling with the problems on the worksheet, then we recommend going back and working through this guide again to ensure that you deeply understand how to graph the equation of a circle.
Graphing Circles Worksheet Preview
Keep Learning:
How to Graph a Parabola in 3 Easy Steps
Your complete guide to graphing a parabola on the coordinate plane using an easy three step process. Step-by-step practice problems and diagrams included.