Log Rules Explained! (Free Chart)

Comment

Log Rules Explained! (Free Chart)

Everything you need to know about the natural log rules.

The Natural Log Rules Explained

In math, log rules (also known as logarithm rules) are a set of rules or laws that you can use whenever you have to simplify a math expression containing logarithms. Basically, log rules are a useful tool that, when used correctly, make logarithms and logarithmic equations simpler and easier to work with when solving problems.

Once you become more familiar with the log rules and how to use the, you will be able to apply them to a variety of math problems involving logarithms. In fact, understanding and remembering the log rules is essentially a requirement when it comes to working with logarithmic expressions, so understanding these rules is essential for any student who is currently learning about logarithms.

The following free guide to the Log Rules shares and explains the rules of logs (including exponent log rules), what they represent, and, most importantly, how you can use them to simplify a given logarithmic expression.

You have the option of clicking on any of the text links below to jump to any one section of this log rules guide, or you can work through each section in order—the choice is up to you!

When you reach the end of this free guide on the rules of logs, you will have gained a solid understanding of the natural log rules and how to apply them to solving complex math problems. Let’s get started!


Figure 01: What is the relationship between the logarithmic function and the exponential function?


Quick Review: Logarithms

While this first section is optional, we recommend that you start off with a quick recap of some key math concepts and vocabulary terms related to logs.

The first important thing to understand is that logarithmic functions and exponential functions go hand-in-hand, as they are considered inverses of each other. So, make sure that you have a strong understanding of the laws of exponents before moving forward.

Since the logarithmic function is an inverse of the exponential function, we can say that:

  • aˣ = M logₐM = x

  • logₐM = x aˣ = M

The log of any value, M, can be expressed in exponential form as the exponent to which the base value of the logarithm must be raised to in order to equal M.

Understanding this inverse relationship between the logarithmic function and the exponential function will help you to better understand the log rules described in the following sections of this guide.

Learning natural log rules shared in the next section will help you to break down complex log expressions into simpler terms, which is a critical skill when it comes to learning how to successfully work with logs, how to model situations using logs, and how to solve a variety of math problems that involve logs.


What are the Log Rules?

The natural log rules are set of laws that you can use to simplify, expand, or solve logarithmic functions and equations.

The chart in Figure 02 below illustrates all of the log rules. Simply click the blue text link below the chart to download it as a printable PDF, which you can use as a study tool and a reference guide.

The section that follows the log rules chart will share an in-depth explanation of each of the log rules along with examples.


Figure 02: The Natural Log Rules and the Change of Base Formula


Each of the following log rules apply provided that:

  • a≠1 and a>0, b≠1 and b>0, a=b, and M, N, and x are real numbers where M>0 and N>0

Log Rules: The Product Rule

The first of the natural log rules that we will cover in this guide is the product rule:

  • logₐ(MN) = logₐM + logₐN


Figure 03: The product rule of logarithms.


The product rule states that the logarithm a product equals the sum of the logarithms of the factors that make up the product.

For example, we could use the product rule to expand log₃(xy) as follows:

  • log₃(xy) = log₃x + log₃y

Pretty straightforward, right? The product rule of logarithms is a simple tool that will allow you to expand logarithmic expressions and equations, which often makes them easier to work with.


Log Rules: The Quotient Rule

The second of the natural log rules that we will cover in this guide is called the quotient rule, which states that:

  • logₐ(M/N) = logₐM - logₐN; or

  • logₐ(MN) = logₐM - logₐN


Figure 04: Natural Log Rules: The Quotient Rule


The quotient rule of logs says that the logarithm a quotient equals the difference of the logarithms that are being divided (i.e. it equals the logarithm of the numerator value minus the logarithm of the denominator value).

For example, we could use the quotient rule to expand log₇(x/y) as follows:

  • log₇(x/y) = log₇x - log₇y

Notice that the product rule and the quotient rule of logarithms are very similar to the corresponding laws of exponents, which should make sense because the logarithmic function and the exponential function are inverses of each other.


Log Rules: The Power Rule

The next natural log rule is called the power rule, which states that:

  • logₐ(Mˣ) = x logₐM


Figure 05: Log Rules: The Power Rule


The power rule of logarithms says that the log of a number raised to an exponent is equal to the product of the exponent value and the logarithm of the base value.

For example, we could use the power rule to rewrite log₄(k⁸) as follows:

  • log₄(k⁸) = 8 log₄k

The power rule of logarithms is extremely useful and it often comes in handy when you are dealing with the logarithms of exponential values, so make sure that you understand it well before moving forward.


Log Rules: The Zero Rule

Moving on, the next log rule on our list is the zero rule, which states that:

  • logₐ(1) = 0


Figure 06: Log Rules: The Zero Rule


Simply put, the zero rule of logs states that the log of 1 will always equal zero as long as the base value is positive and not equal to one.

For example, we could use the zero rule to rewrite log₂(1) as follows:

  • log₂(1) = 0

This simple rule can be very useful whenever you are trying to simplify a complex logarithmic expression or equation. The ability to zero out or cancel out a term can make things much simpler and easier to work with.


Log Rules: The Identity Rule

The fifth log rule on our list is called the identity rule, which states that:

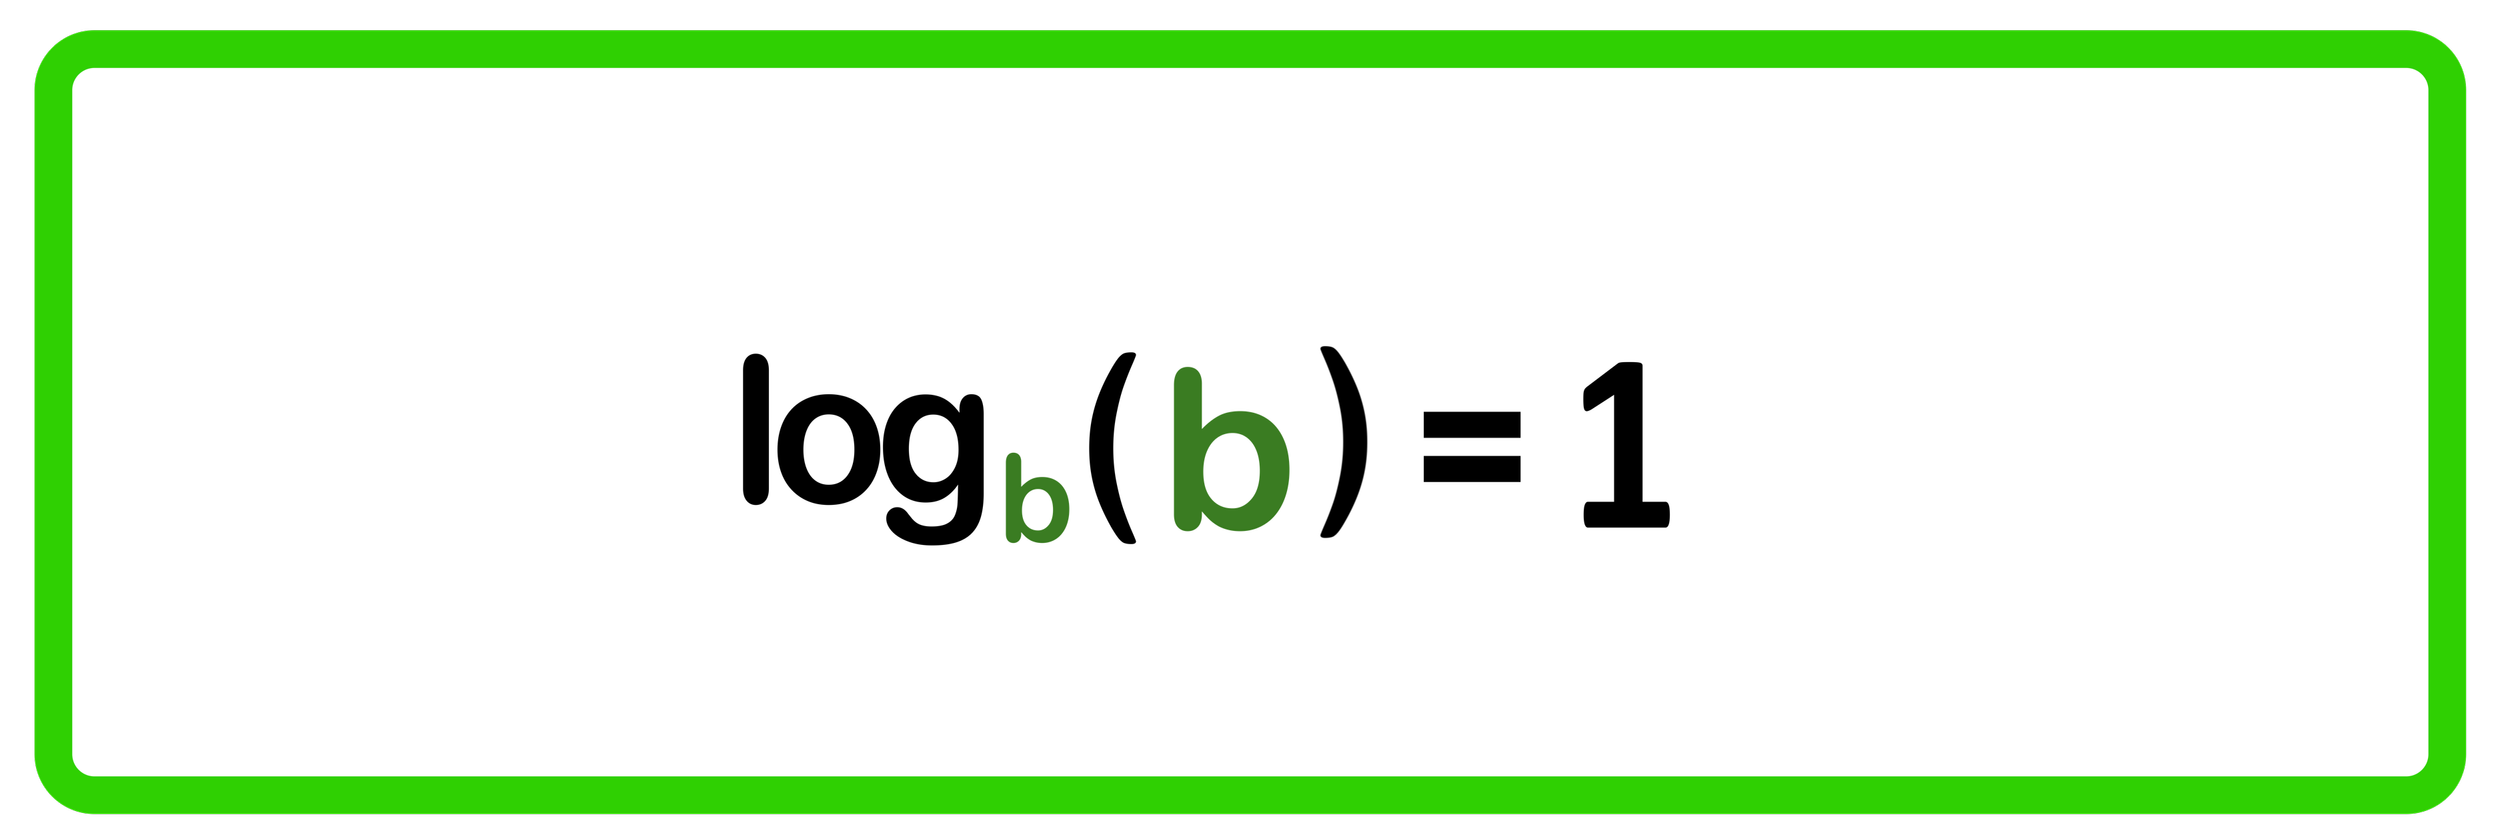
  • logₐ(a) = 1


Figure 07: Natural Log Rules: The Identity Rule


The identity rule says that whenever you take the logarithm of a value that is equal to its base value, then the result will always equal 1 provided that the base value is greater than zero and not equal to one.

For example, we could use the identity rule to rewrite log₈(8) as follows:

  • log₈(8) = 1

Similarly, we could also use the identity rule to rewrite logₓ(x) as follows:

  • logₓ(x) = 1

Just like the zero rule, the identity rule is useful as it can sometimes help you with simplifying complex log expressions and equations.


Log Rules: The Inverse Property of Logs

The next log rule that we will cover in this guide is called the inverse property of logarithms rule, which states that:

  • logₐ(aˣ) = x


Figure 08: The inverse property of logs rule.


The inverse property of logs rule states that the log of a number raised to an exponent with a base value that is equal to the base value of the logarithm is equal to the value of the exponent.

For example, we could use the inverse property of logs rule to rewrite log₃(3ᵏ) as follows:

  • log₃(3ᵏ) = k

Again, this is another useful tool that you can use to simplify complicated log expressions and equations.


Log Rules: The Inverse Property of Exponents

The seventh log rule that we will cover is the inverse property of exponents rule, which states that:

  • a^(logₐ(x)) = x


Figure 09: Log Rule #7: The Inverse Property of Exponents


The inverse property of exponents log rule states whenever a base number with an exponent that is a logarithm equal to that base number, the result will equal the number in parenthesis.

For example, we could use the inverse property of exponents log rule to rewrite x^(logₓ(y²)) as follows:

  • x^(logₓ(y²)) = y²


Log Rules: The Change of Base Formula

The eighth and final log rule is the change of base formula, which states that:

  • logₐ(x) = (log꜀(x)) / (log꜀(a))


Figure 10: Log Rule: The Change of Base Formula


Conclusion: Natural Log Rules

In algebra, you will eventually have to learn how to simplify, expand, and generally work with logarithmic expressions and equations. The logarithm function is the inverse of the exponential function, and the corresponding log rules are similar to the exponent rules (i.e. they are a collection of laws that will help you to make complex log expressions and equations easier to work with). By studying and learning how to the natural log rules, you will be better able to understand logarithms and to solve difficult math problems involving logarithms. Feel free to bookmark this guide and return whenever you need a review of the rules of logs.

Keep Learning:

Comment

Idea: How to Engage Your Students at the Start of Any Lesson

22 Comments

Idea: How to Engage Your Students at the Start of Any Lesson

Image Credit: Mashup Math MJ

Capturing your students’ interest and curiosity during the first few minutes of class is the key to keeping them engaged for your entire lesson.

But not all math warm up activities are created equally.

Math teachers miss out on activating their students’ critical thinking and reasoning skills when they assign routine, lower-level practice problems during the first five minutes of class.

However, when you use the right mix of fun and though-provoking math warm up activities to start your lessons, student engagement spikes, as your kids will constantly be wondering about what is coming next.

You probably already have some awesome math warm up activities—like Which One Doesn’t Belong? and Think-Notice-Wonder—in your tool belt. But if you’re looking for another great strategy for mixing up your instruction and engaging your students, then get ready for:

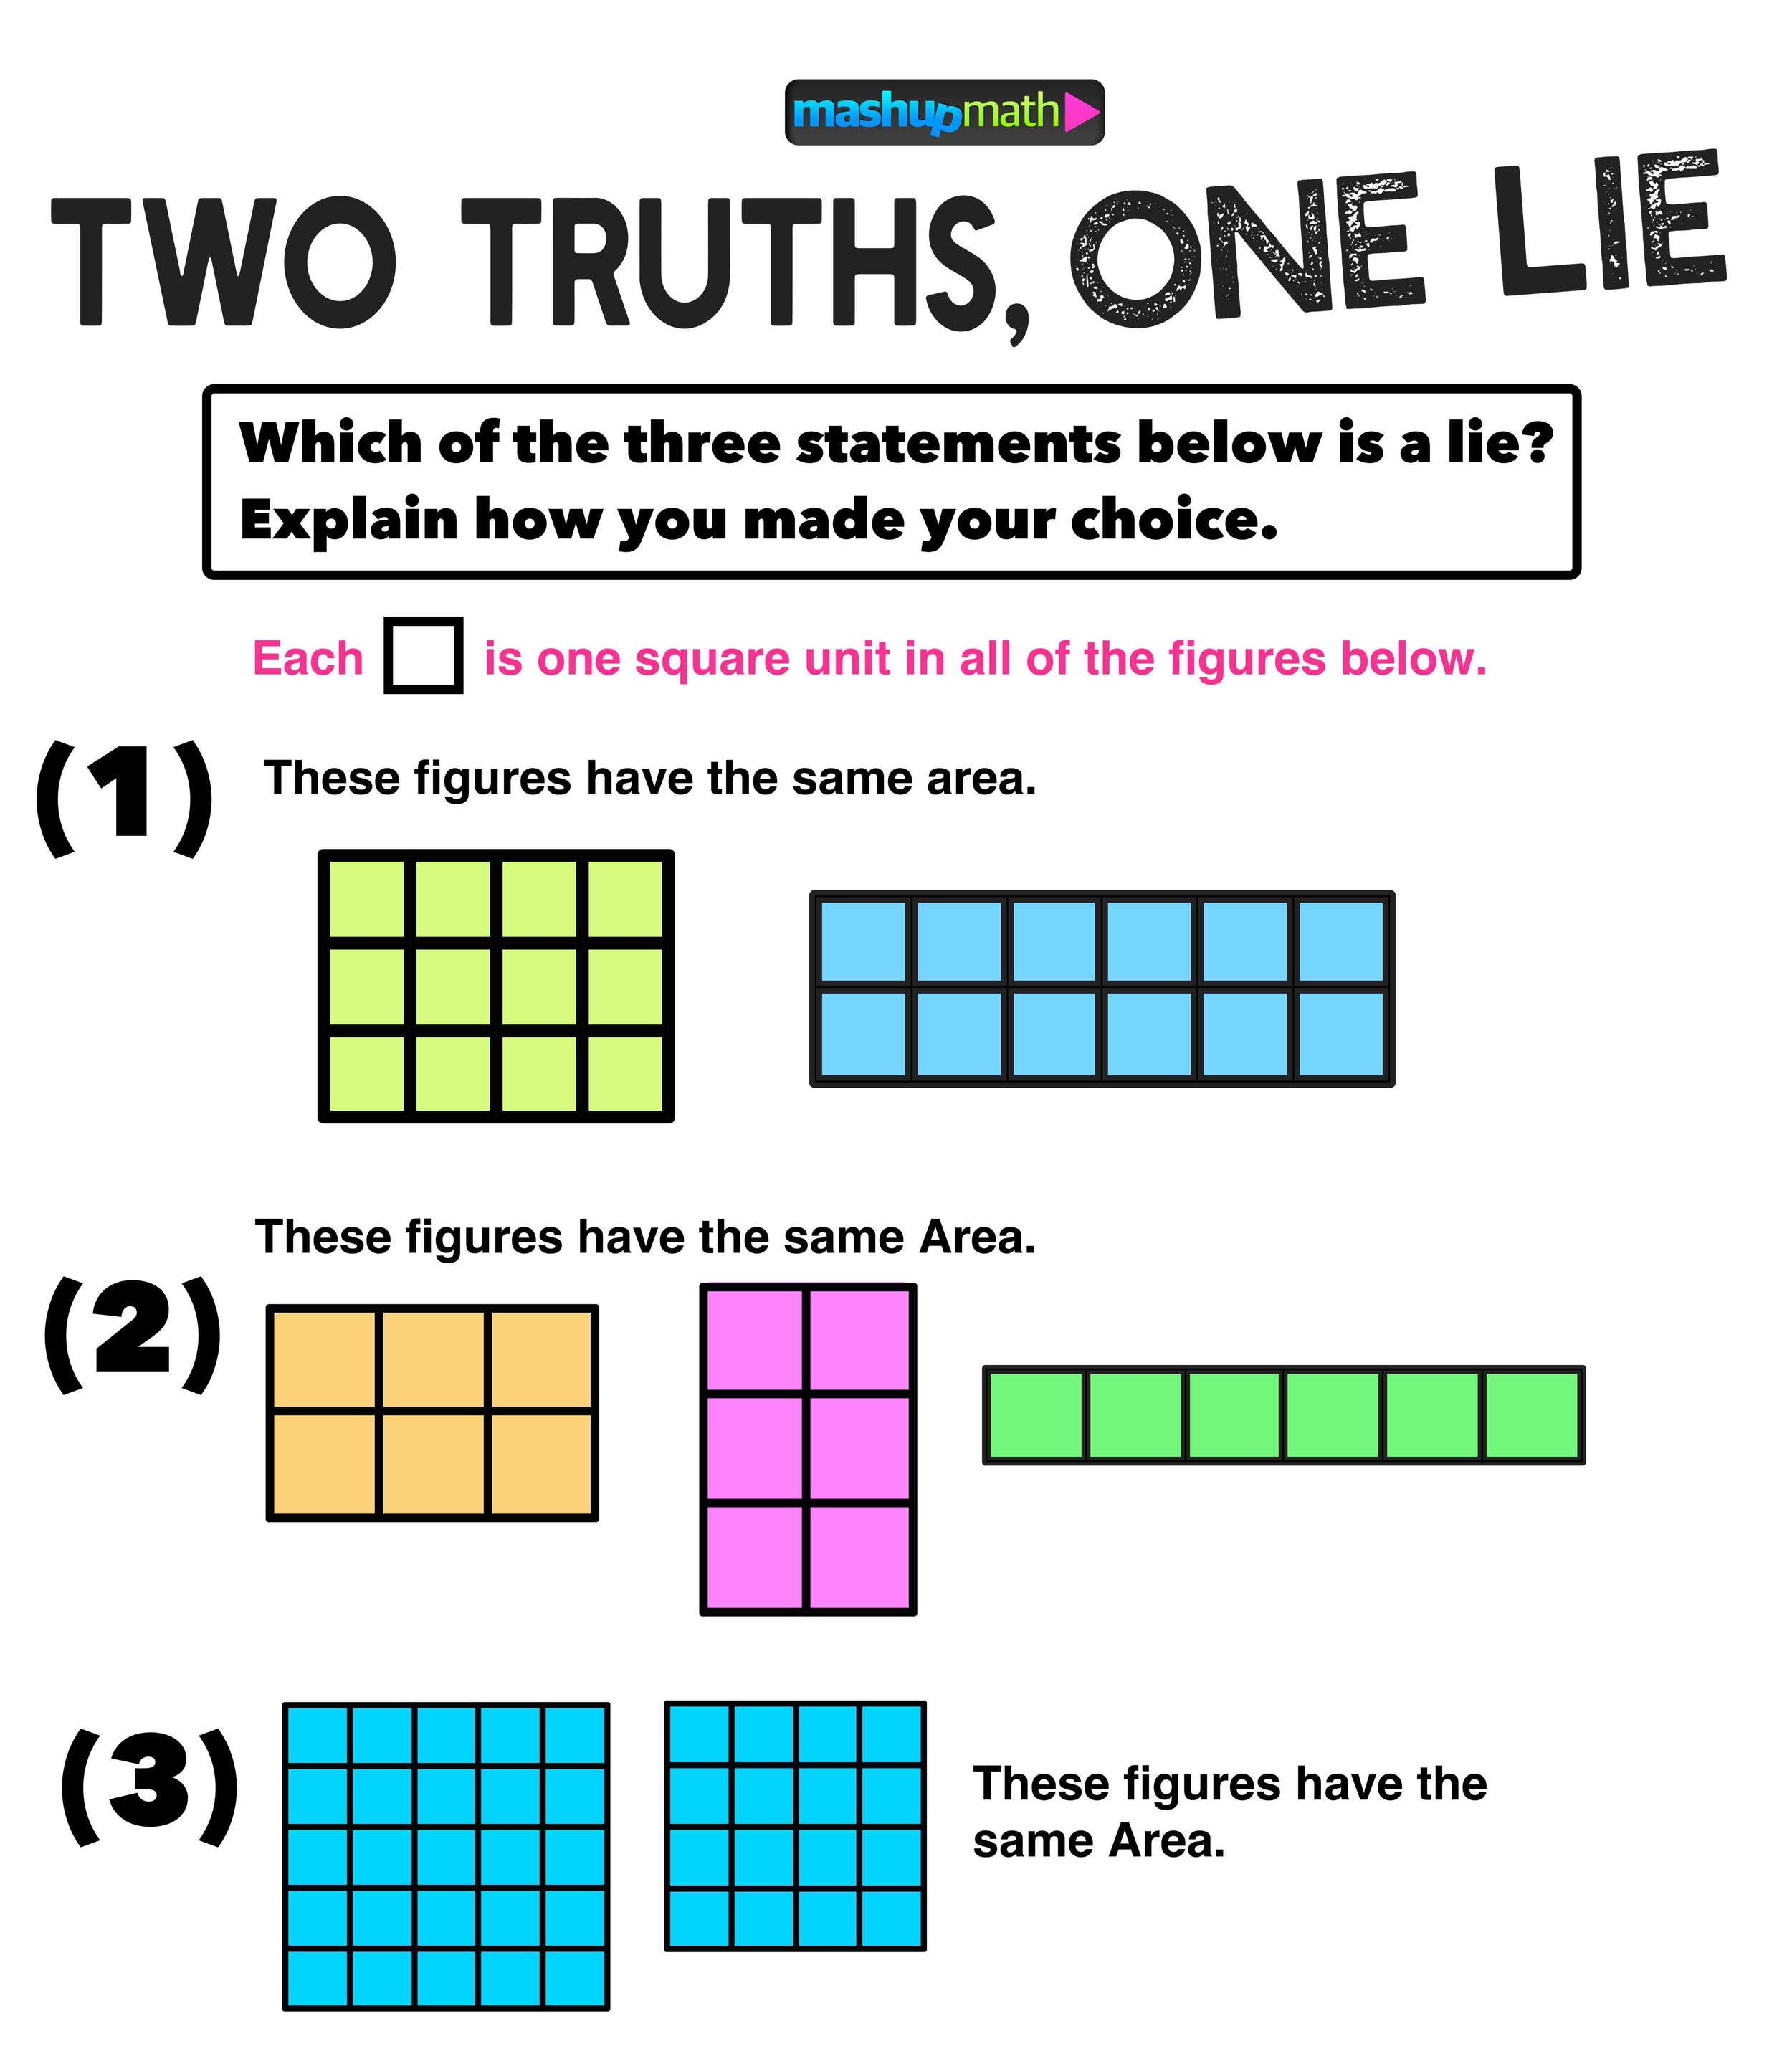
Two Truths and One Lie!

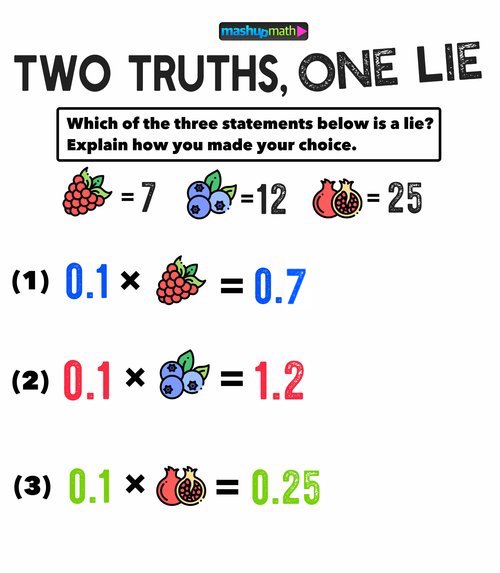
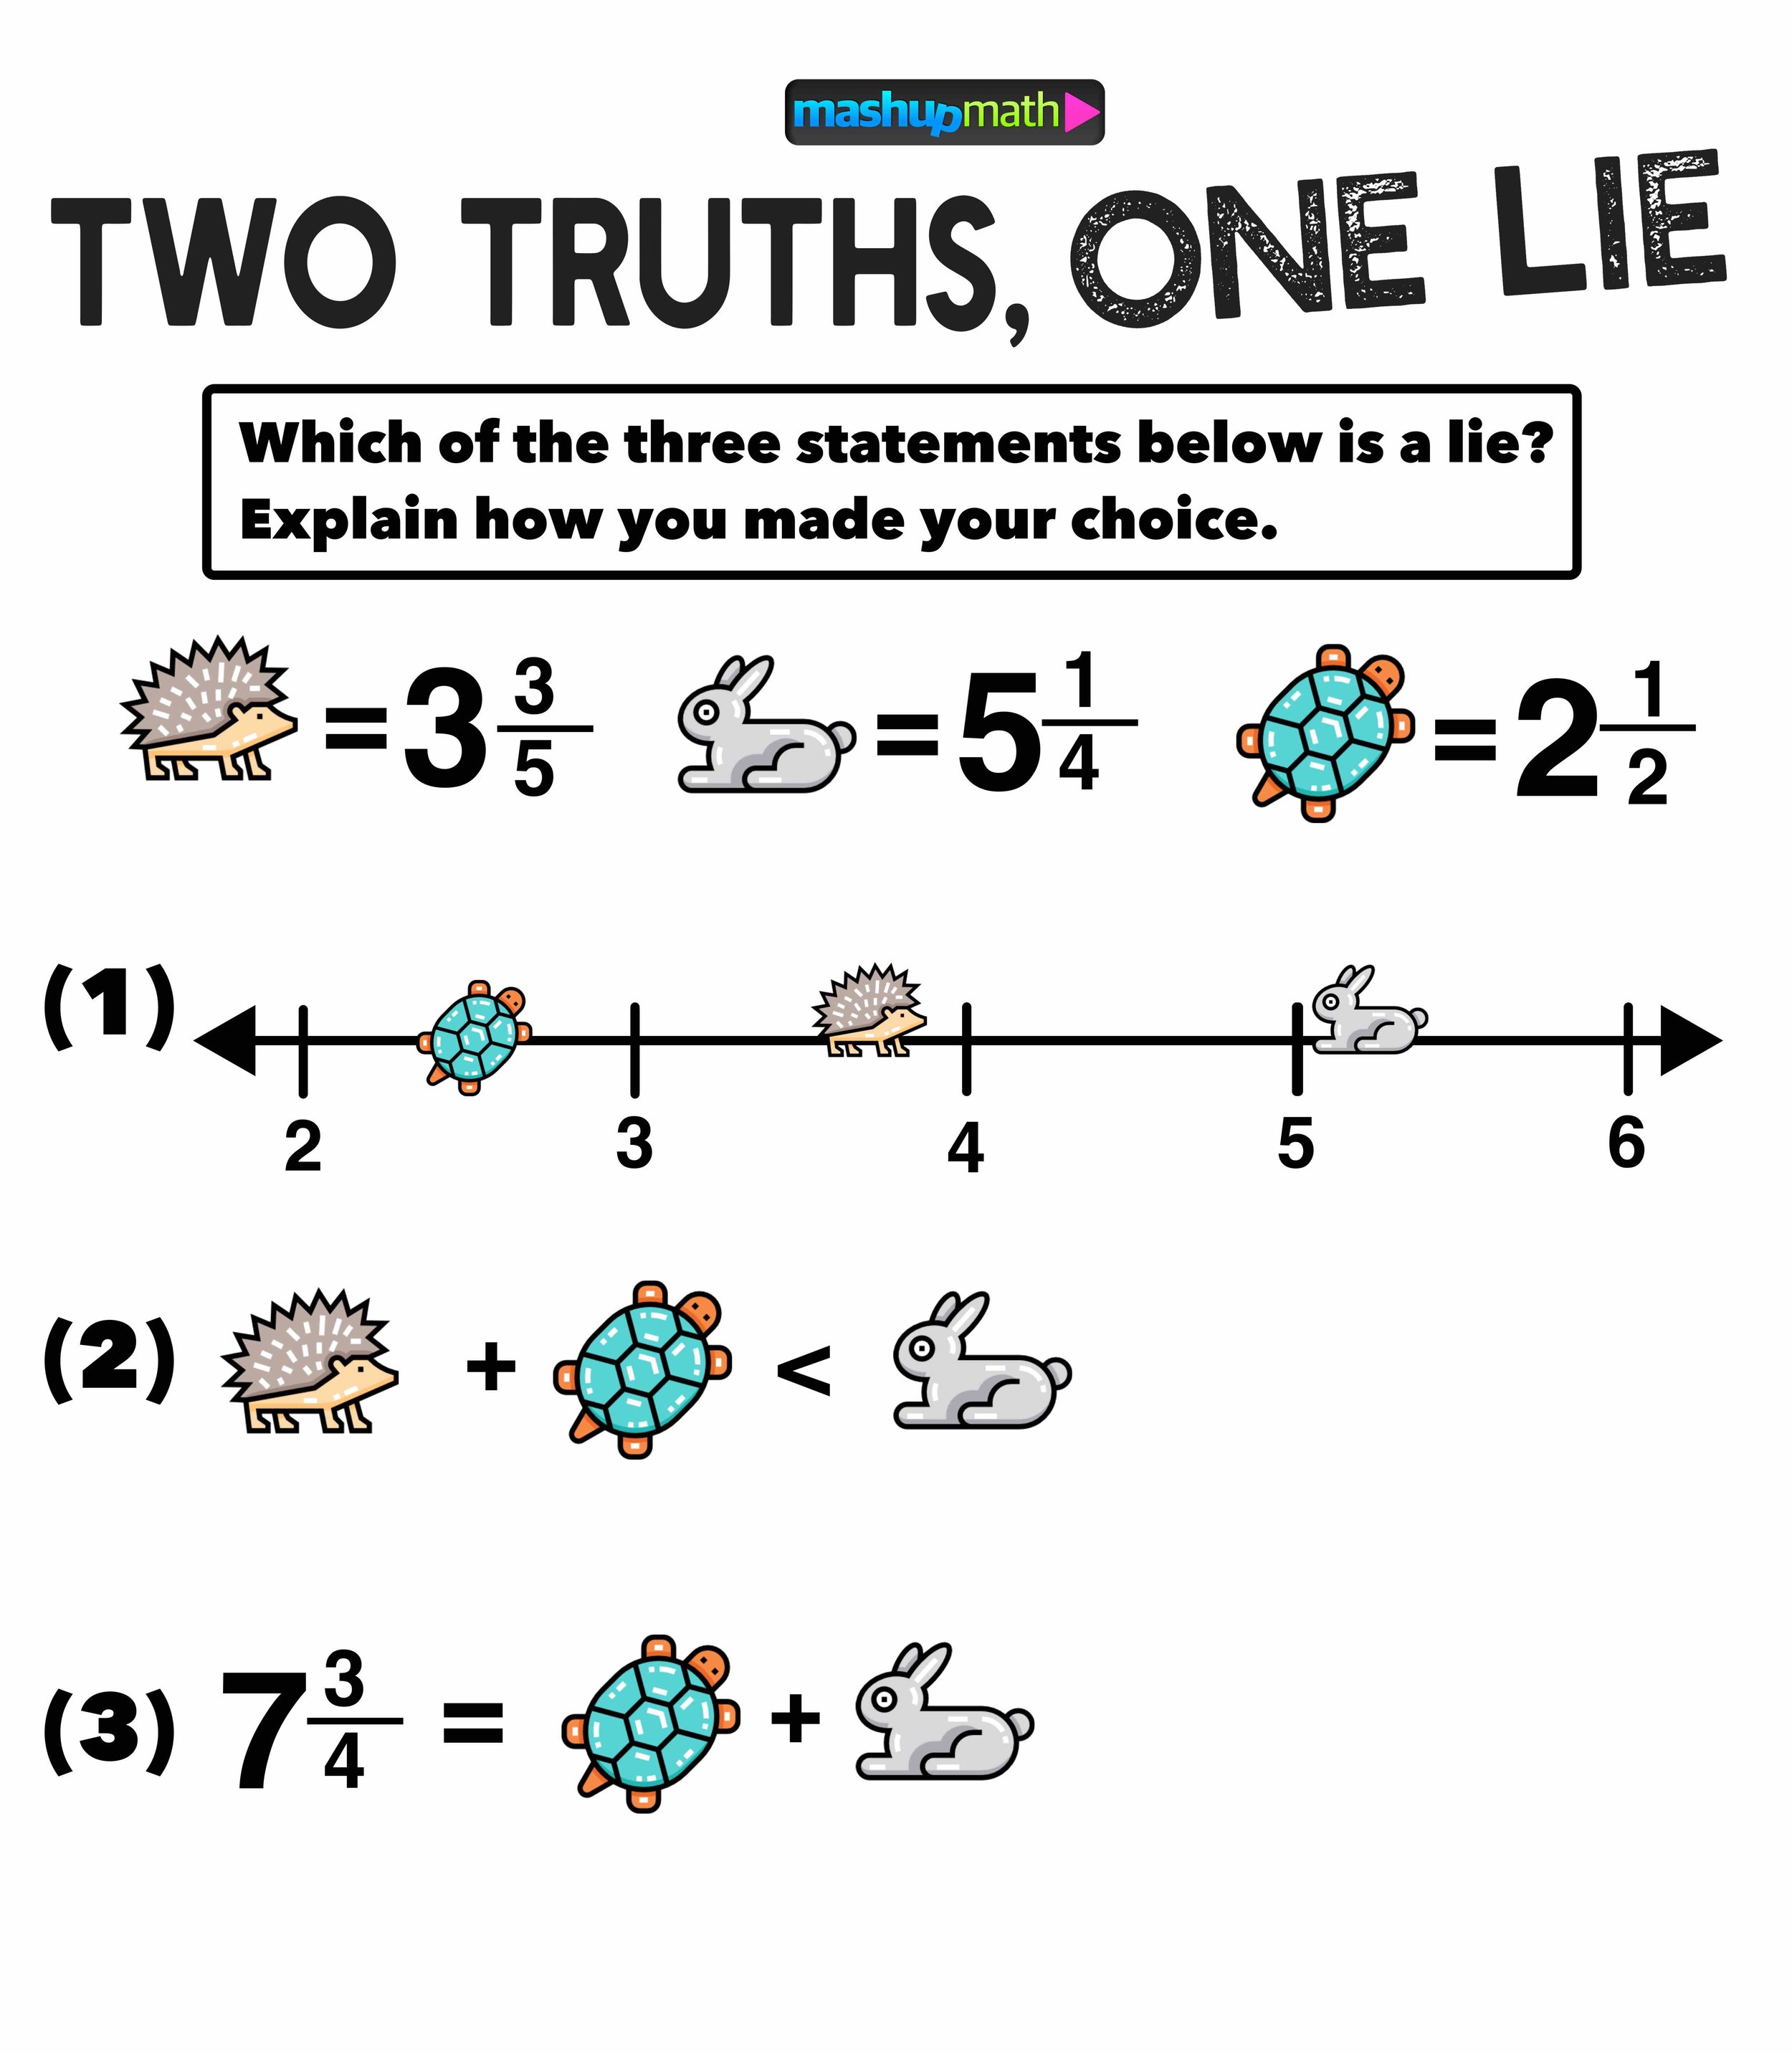
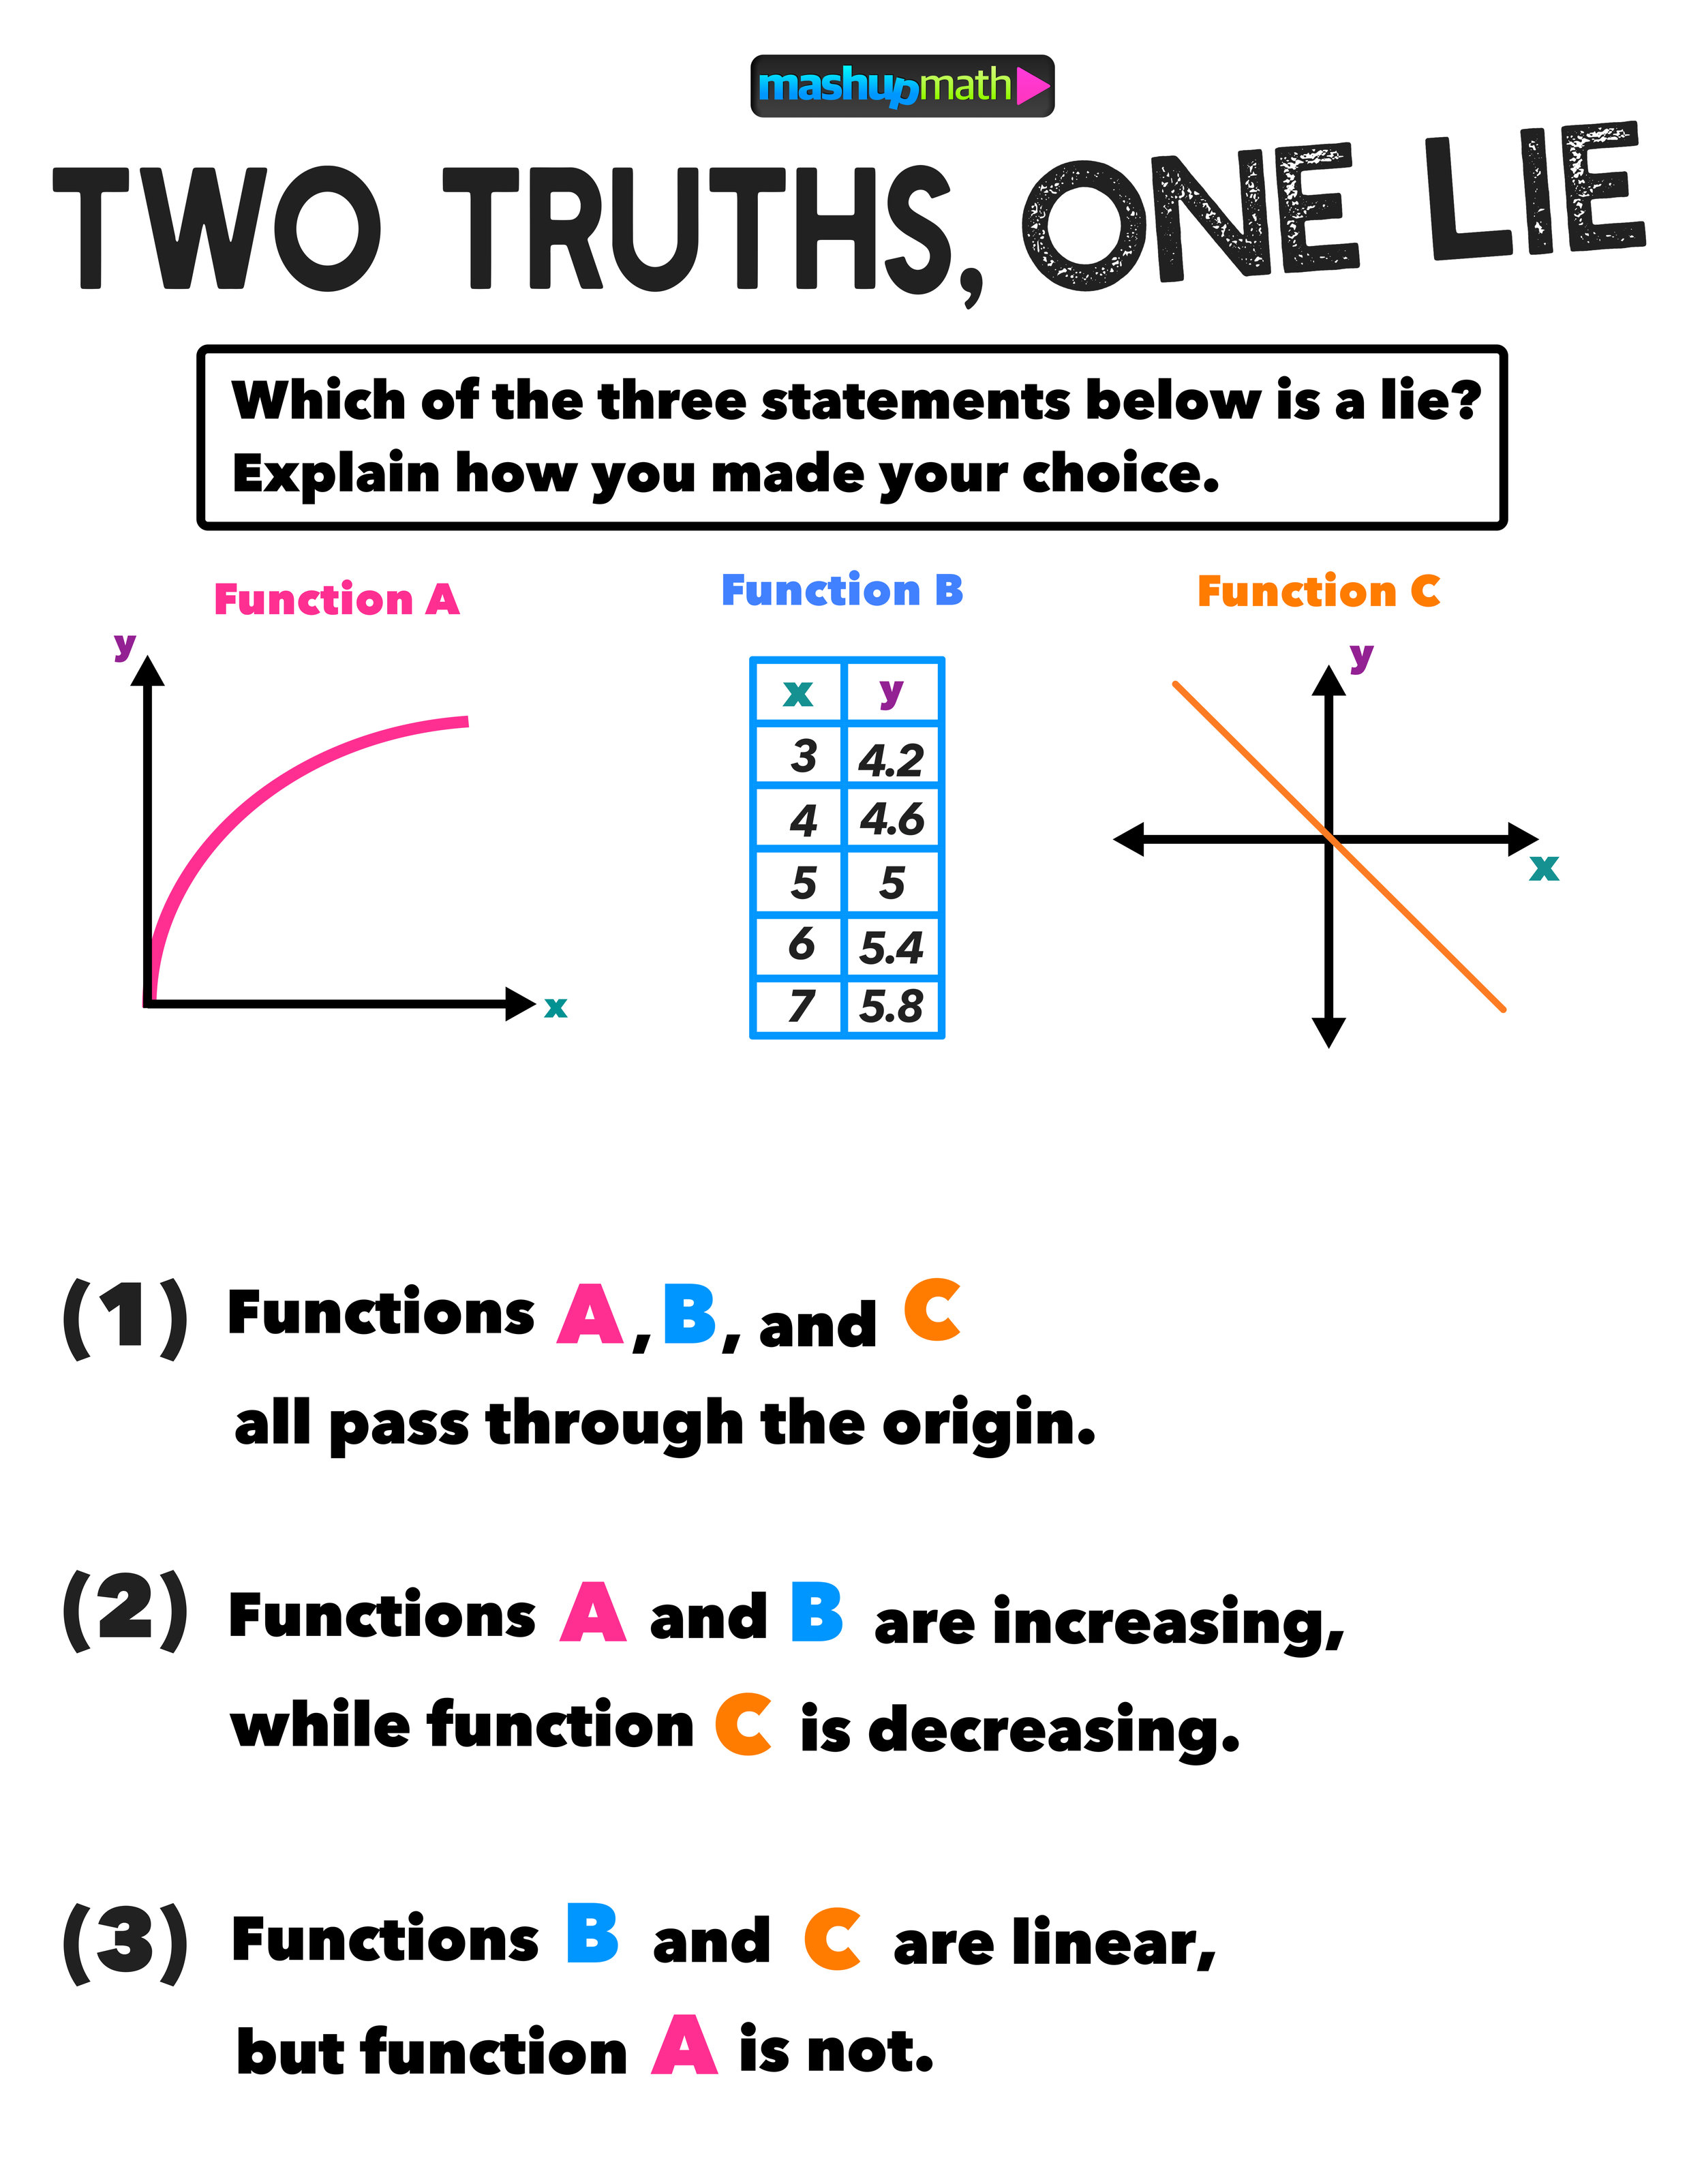
I recently started using Two Truths and One Lie (2T1L) activities, where students are presented with three mathematical statements (only two of which are true) and they have to identify which statement is a lie and justify why their choice is correct. The results? Pretty amazing. 2T1L taught me that my students love to argue and state their case (in small groups or to the whole class).

In short, 2T1L is a fun way to spark deep mathematical thinking and open discussion at the start (or end—2T1L activities make great exit tickets) of any lesson.

DpT27KvUcAAXiOw.jpg

Image Source: Mashup Math ST

What topics/grade levels are 2T1L activities best suited for?

2T1L activities can be used for all grade levels and topics. The graphics should be topic/lesson specific and can include graphs, charts, and diagrams.


Here are some grade-level specific samples:

Imagine how your students would react to starting class with one of the following activities.

  • What kind of creative and mathematical thinking would spark?

  • What kind of small or large group discussions would occur?

  • How would a spike in engagement effect the remainder of the lesson?

3rd Grade ▼

21.jpg

6th Grade ▼

4th Grade ▼

29.jpg

7th Grade ▼

70.jpg

5th Grade ▼

26.jpg

8th Grade ▼

101.jpg

Are you ready to give it a try?

Here are a few more free samples that you can download and share with your kids (right-click to download each graphic and save it to your computer):

Looking for more for grades 3, 4, & 5? Download your 101 ‘Two Truths and One Lie!’ Math Activities for Grades 3, 4, & 5 eBook!

Looking for more for grades 6, 7, & 8? Download your 101 ‘Two Truths and One Lie!’ Math Activities for Grades 6, 7, & 8 eBook!

Looking for more?

You can now share 101 Daily Two Truths & One Lie! Math Activities for Grades 3, 4, & 5 OR Grades 6, 7, & 8 with your kids with our brand new PDF workbooks!

345.jpg
678.jpg

Read More Posts About What’s Trending in Math Education:

Do you have experience using 2T1L activities with your math students? Share your thoughts and suggestions in the comments section below!

(Never miss a Mashup Math blog--click here to get our weekly newsletter!)

By Anthony Persico

NewBlogImage.png

Anthony is the content crafter and head educator for YouTube's MashUp Math and an advisor to Amazon Education's 'With Math I Can' Campaign. You can often find me happily developing animated math lessons to share on my YouTube channel . Or spending way too much time at the gym or playing on my phone.

 
pin.jpg
 

22 Comments

Free Printable Ruler with Fractions

1 Comment

Free Printable Ruler with Fractions

Free Printable Ruler with Fractions

Free Printable Ruler with Fractions

Are you in need of a ruler with fractions to help you make exact measurements?

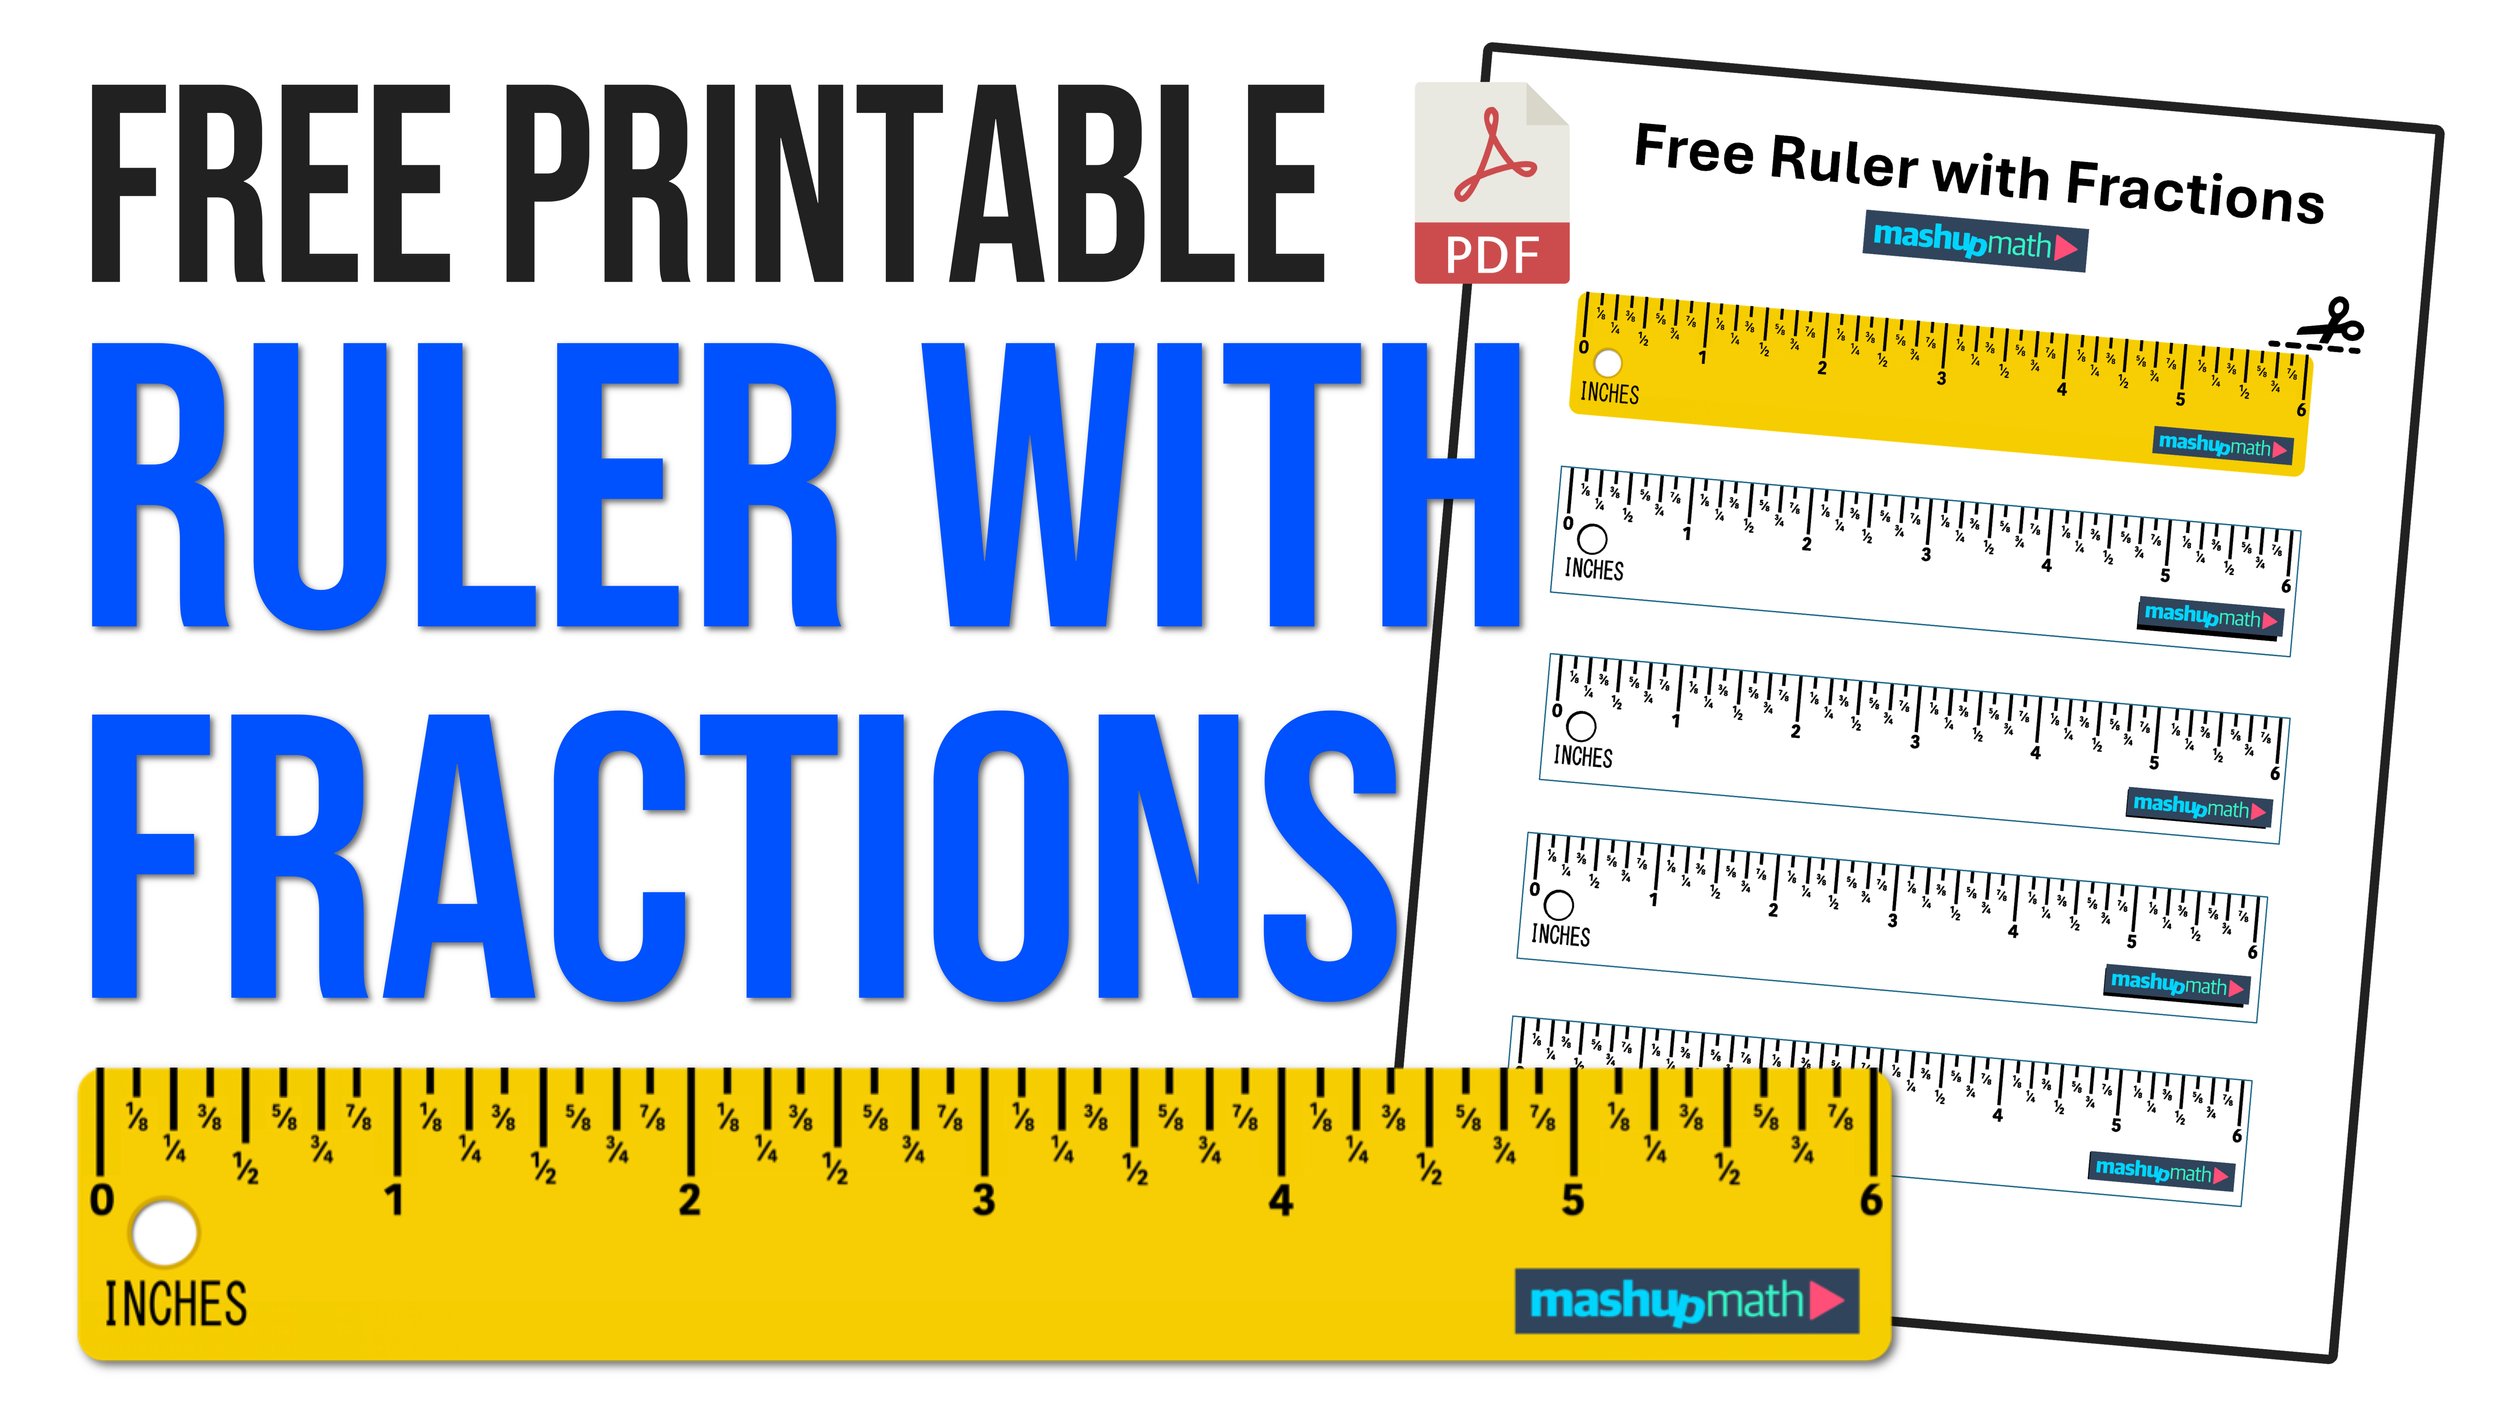
If so, you can use the text link below to download your free printable ruler with fractions as a PDF file. The pdf includes multiple rulers that you can cut out using a scissor and then use to make accurate measurements to the nearest eighth of an inch.

Click Here to Download Your Free Printable Ruler with Fractions

Preview: Ruler with Fractions (Image: Mashup Math)

Printing Instructions: To ensure that your rulers print out to exact proportions, it is essential that you print on standard US Letter Paper (8.5x11 inches) and that your printer’s settings are correctly assigned before you print the ruler with fractions pdf file. Before you print, make sure that your printer settings are set to portrait orientation (not landscape) and make sure that the scale is set to 100% size. Inputting the correct settings will ensure that the printable ruler will be exactly six inches long with perfect proportions. Note that many printers have a default “Fit to Page” print setting that will likely alter the scale of the printed ruler, making it an inaccurate measuring tool. You can verify whether or not your printed ruler is accurate by testing it against a standard ruler.

See the graphic in Figure 01 below for more detailed printer instructions.


Figure 01: Printable Rulers with Fractions Printing Instructions


Free Printable Ruler with Fractions: How to Use a Ruler

You can use the free printable ruler with fractions above to make exact measurements the same way that you would a typical wooden, metal, or plastic ruler.

Simply follow the printing instructions above to print out the free ruler with fractions PDF and then use a scissor to cut out one of the rulers and then follow the instructions below to start making measurements:

Once you have your ruler completely cut out, start by familiarizing yourself with the measurement lines on the ruler face. The longest lines mark the inch segments and they range from 0 to 6. In between each one inch segments there are 7 shorter lines that each represent fractions of an inch (one-eight or 1/8 to be precise). The line directly halfway between each one inch marker is the half-inch mark, followed by the quarter-inch mark, followed by the one-eight inch marks. Each of these divisions is labeled on your ruler with a simplified fraction.

To measure using a ruler with fractions, align the left end of the ruler with the edge of the object (directly at the zero inch mark). Then, observe the location of the other edge of the object and where it aligns with the ruler. The mark where the object ends on the ruler is where you will locate its measurement in inches. By understanding the fractional divisions on a ruler, you will be able to make accurate and consistent measurements.

Figure 02 below shows an example of how you could use a ruler with fractions to measure a mini-pencil.

Figure 02: Example of how to use a ruler with fractions to make accurate measurements. (Image: Mashup Math MJ)

Need some extra help with how to measure objects using a ruler? Check out our free video tutorial on YouTube.

Keep Learning:
1 Comment

Graphing Inequalities on a Number Line Explained

1 Comment

Graphing Inequalities on a Number Line Explained

Graphing Inequalities on a Number Line

Math Skills: How to Graph Inequalities on a Number Line


Free Step-by-Step Guide: Graphing Inequalities on a Number Line


Graphing inequalities on a number line is an important math skill that helps students to visualize all of the possible solutions to any given inequality equation. Whether you are a middle school student learning about inequalities for the first time, or if you simply need a review of how to graph inequalities on a number line, this student guide will teach you everything you need to know about graphing inequalities on a number line.

In this free step-by-step tutorial on Graphing Inequalities on a Number Line, you will learn how to accurately graph an inequality on a number line using a simple three-step method. Once you learn our three-step method for graphing inequalities and work through a few example problems, you will be able to solve any math problem that requires you to graph an inequality on a number line.

This tutorial is organized by the following subtopics (you can follow each section in order or you can use the quick-links below to jump to a subtopic of interest):

Now we are ready to get started with a quick recap of inequalities and what they represent.


Lesson Preview: How to Graph Inequalities on a Number Line.


Quick Recap: Inequalities

Before we work through some examples of graphing inequalities on a number line, it is important that you understand some key vocabulary and concepts related to inequalities and inequality equations.

What is an inequality?

Definition: In math, an inequality is a relationship where two values or expressions that are not equal to each other are being compared. Since the two values or expressions are not equal, rather than using an equals sign (=), we use an inequality sign.

There are four types of inequalities, each with its own sign:

  • Greater Than: >

  • Less Than: <

  • Greater Than or Equal To: ≥

  • Less Than or Equal To: ≤

These four types of inequality signs are illustrated in Figure 01 below.


Figure 01: The four types of inequality symbols.


What is an inequality equation?

An inequality equation is an equation that uses an inequality symbol instead of an equals sign.

While an equation with an equals sign has only one possible solution, an inequality equation has infinite possible solutions.

For example, let’s consider the linear equation x=5. The only value of x that would make this equation true is 5 (since 5 is the only number that equals 5).

However, what if we changed the equals to sign (=) to an inequality? For example, consider the inequality x≥5. This inequality means that “x is greater than or equal to 5”. In other words, any value that is equal to 5 or greater would be a solution to this inequality (e.g. 6, 29, 88.3, and 997 would all be solutions).

Again, equations have one possible solution, while inequalities have an infinite amount of possible solutions:

  • Linear Equation: x=5 → 5 is the only solution

  • Inequality: x≥5 → Any value that is 5 or larger can be a solution

Figure 02 below illustrates the difference between the solution of an equation and the solution of an inequality.


Figure 02: What is the difference between the solution of a linear equation and the solution of an inequality?


Now that you know the difference between the solution of an equation (one possible solution) and the solution of an inequality (infinite amount of solutions), it can be super helpful to graph the solution of an inequality on a number line so that you may visual the set of numbers that holds all of possible solutions of an inequality.

Let’s take a closer look at the graph of the inequality x≥5 on a number line.

This inequality has a solution where x can be any number that is 5 or larger. Here are some examples of solutions and non-solutions:

  • Solutions: 5, 6, 9, 25, 309

  • Non-Solutions: 4, 3, 0, -51

The graph of x≥5 on a number line, as shown in Figure 03 below makes it very easy for us to visualize whether or not a given number is a solution or a non-solution.


Figure 03: How to Graph Inequalities on a Number Line: x≥5


Looking at the graph above, we can see that there is a shaded circle over 5 and an arrow starting from that circle and moving along the number line towards the right.

Every number beneath this arrow will be a solution to the inequality. Every number that is not underneath the arrow will be a non-solution.

Now that you understand how to read the graph of an inequality on a number line and why such a graph is so useful, you are ready to learn how to graph inequalities on a number line on your own!

How to Graph Solutions to Inequalities on a Number Line

Here are three easy steps that you can follow in reference to graphing inequalities on a number line:

  • Step One: Determine whether the circle will be open or closed and plot it on the number line.

  • Step Two: Make sure that the variable is on the left side of the inequality and determine the direction of the arrow.

  • Step Three: Draw your arrow and complete the graph.

Before we dive into the practice problems, let’s take a closer look at each step.

We will do this by applying the three steps to the inequalities x>7 and x≤6

Step One: Determine whether the circle will be open or closed and plot it on the number line.

For our first step, we have to determine whether or not the circle on our number line over the number 9 will be open or closed.

To make this determination, we have to look at the inequality sign:

  • Open Circle: > or < (means that the number is not included in the solution set)

  • Closed Circle: ≥ or ≤ (means that the number is included in the solution set)

So, we know that:

  • x > 7 will have an open circle on the number line over the number 7

  • x ≤ 6 will have a closed circle on the number line over the number 6


Figure 04: Inequalities with a > or < sign will have an open circle and inequalities with a ≥ or ≤ sign will have a closed circle.


What is the key difference between an open circle (> or <) and a closed circle (≥ or ≤)?

In cases like x>7 (x is greater than 7), the open circle means that 7 is not a possible solution. This should make sense because 7 is not greater than 7.

In cases like x≤6 (x is less than or equal to 6), the closed circle means that 6 is a possible solution. This should make sense because 6 is less than or equal to 6.

Step Two: Make sure that the variable is on the left side of the inequality and determine the direction of the arrow.

For both of our inequalities, x>7 and x≤6, the variable, x, is already on the left side. So, we just have to determine the direction of the arrow:

  • > or ≥ : arrow travels to the right: →

  • < or ≤: arrow travels to the left: ←

A helpful way to remember how to determine the direction of your arrow is to think of the inequality sign as the head of the arrow. As long as the variable is on the left-side, you can let the direction of the inequality sign dictate the direction of the arrow.

For x>7, the arrow will travel to the right (), and, for x≤6, the arrow will travel to the left ().


Figure 05: > or ≥ arrow travels to the right: →; < or ≤: arrow travels to the left: ←


So, we know that:

  • x > 7 will have an arrow traveling to the right

  • x ≤ 6 will have an arrow traveling to the left

Step Three: Draw your arrow and complete the graph.

For our final step, we simply have to draw our arrow facing in the correct direction and complete our graph.

After completing Step One and Step Two, we determined that:

  • x > 7 has an open circle over 7 with an arrow traveling to the right

  • x ≤ 6 has a closed circle over 6 with an arrow traveling to the left

So, we can complete the graphs of x > 7 and x ≤ 6 as shown in Figure 06 below:


Figure 06: The completed graphs of the inequalities x>7 and x≤ 6 on a number line.


You have just successfully learned how to graph solutions to inequalities on a number line.

Now that you know the three steps to solving the question, how do I graph an inequality on a number line?, you are ready to take on a few more practice problems.


How to Graph Inequalities on a Number Line

Graphing Inequalities on a Number Line Example 1

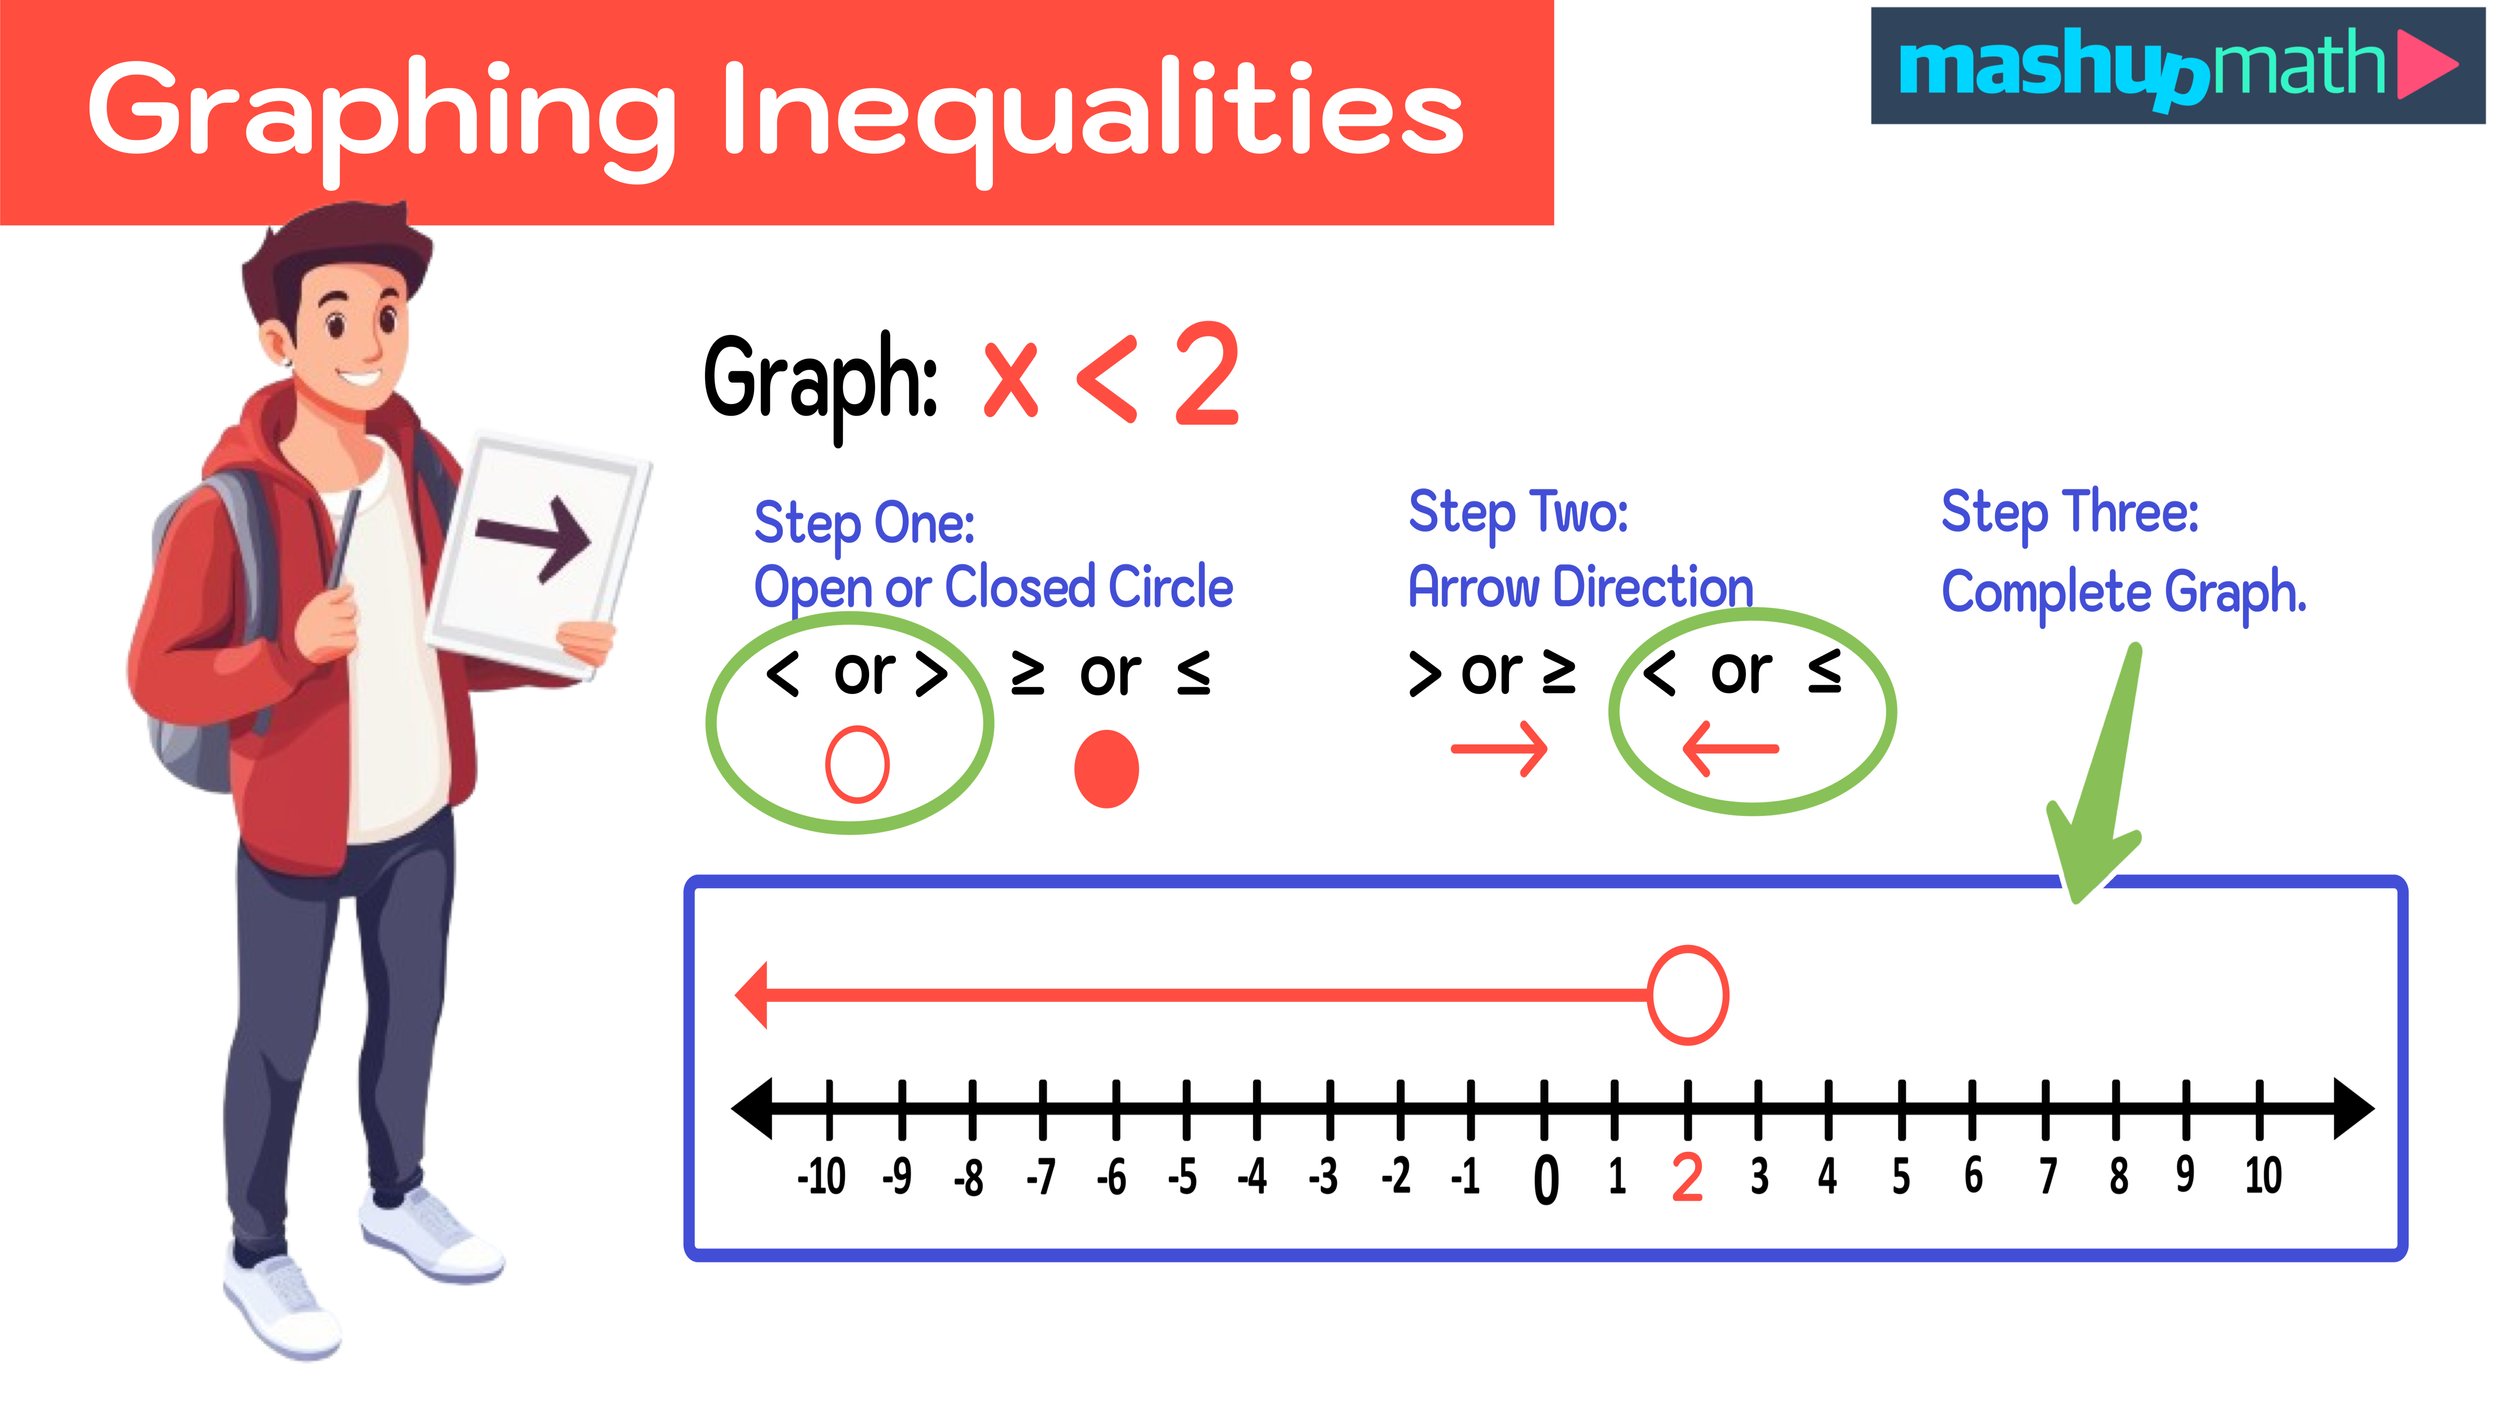
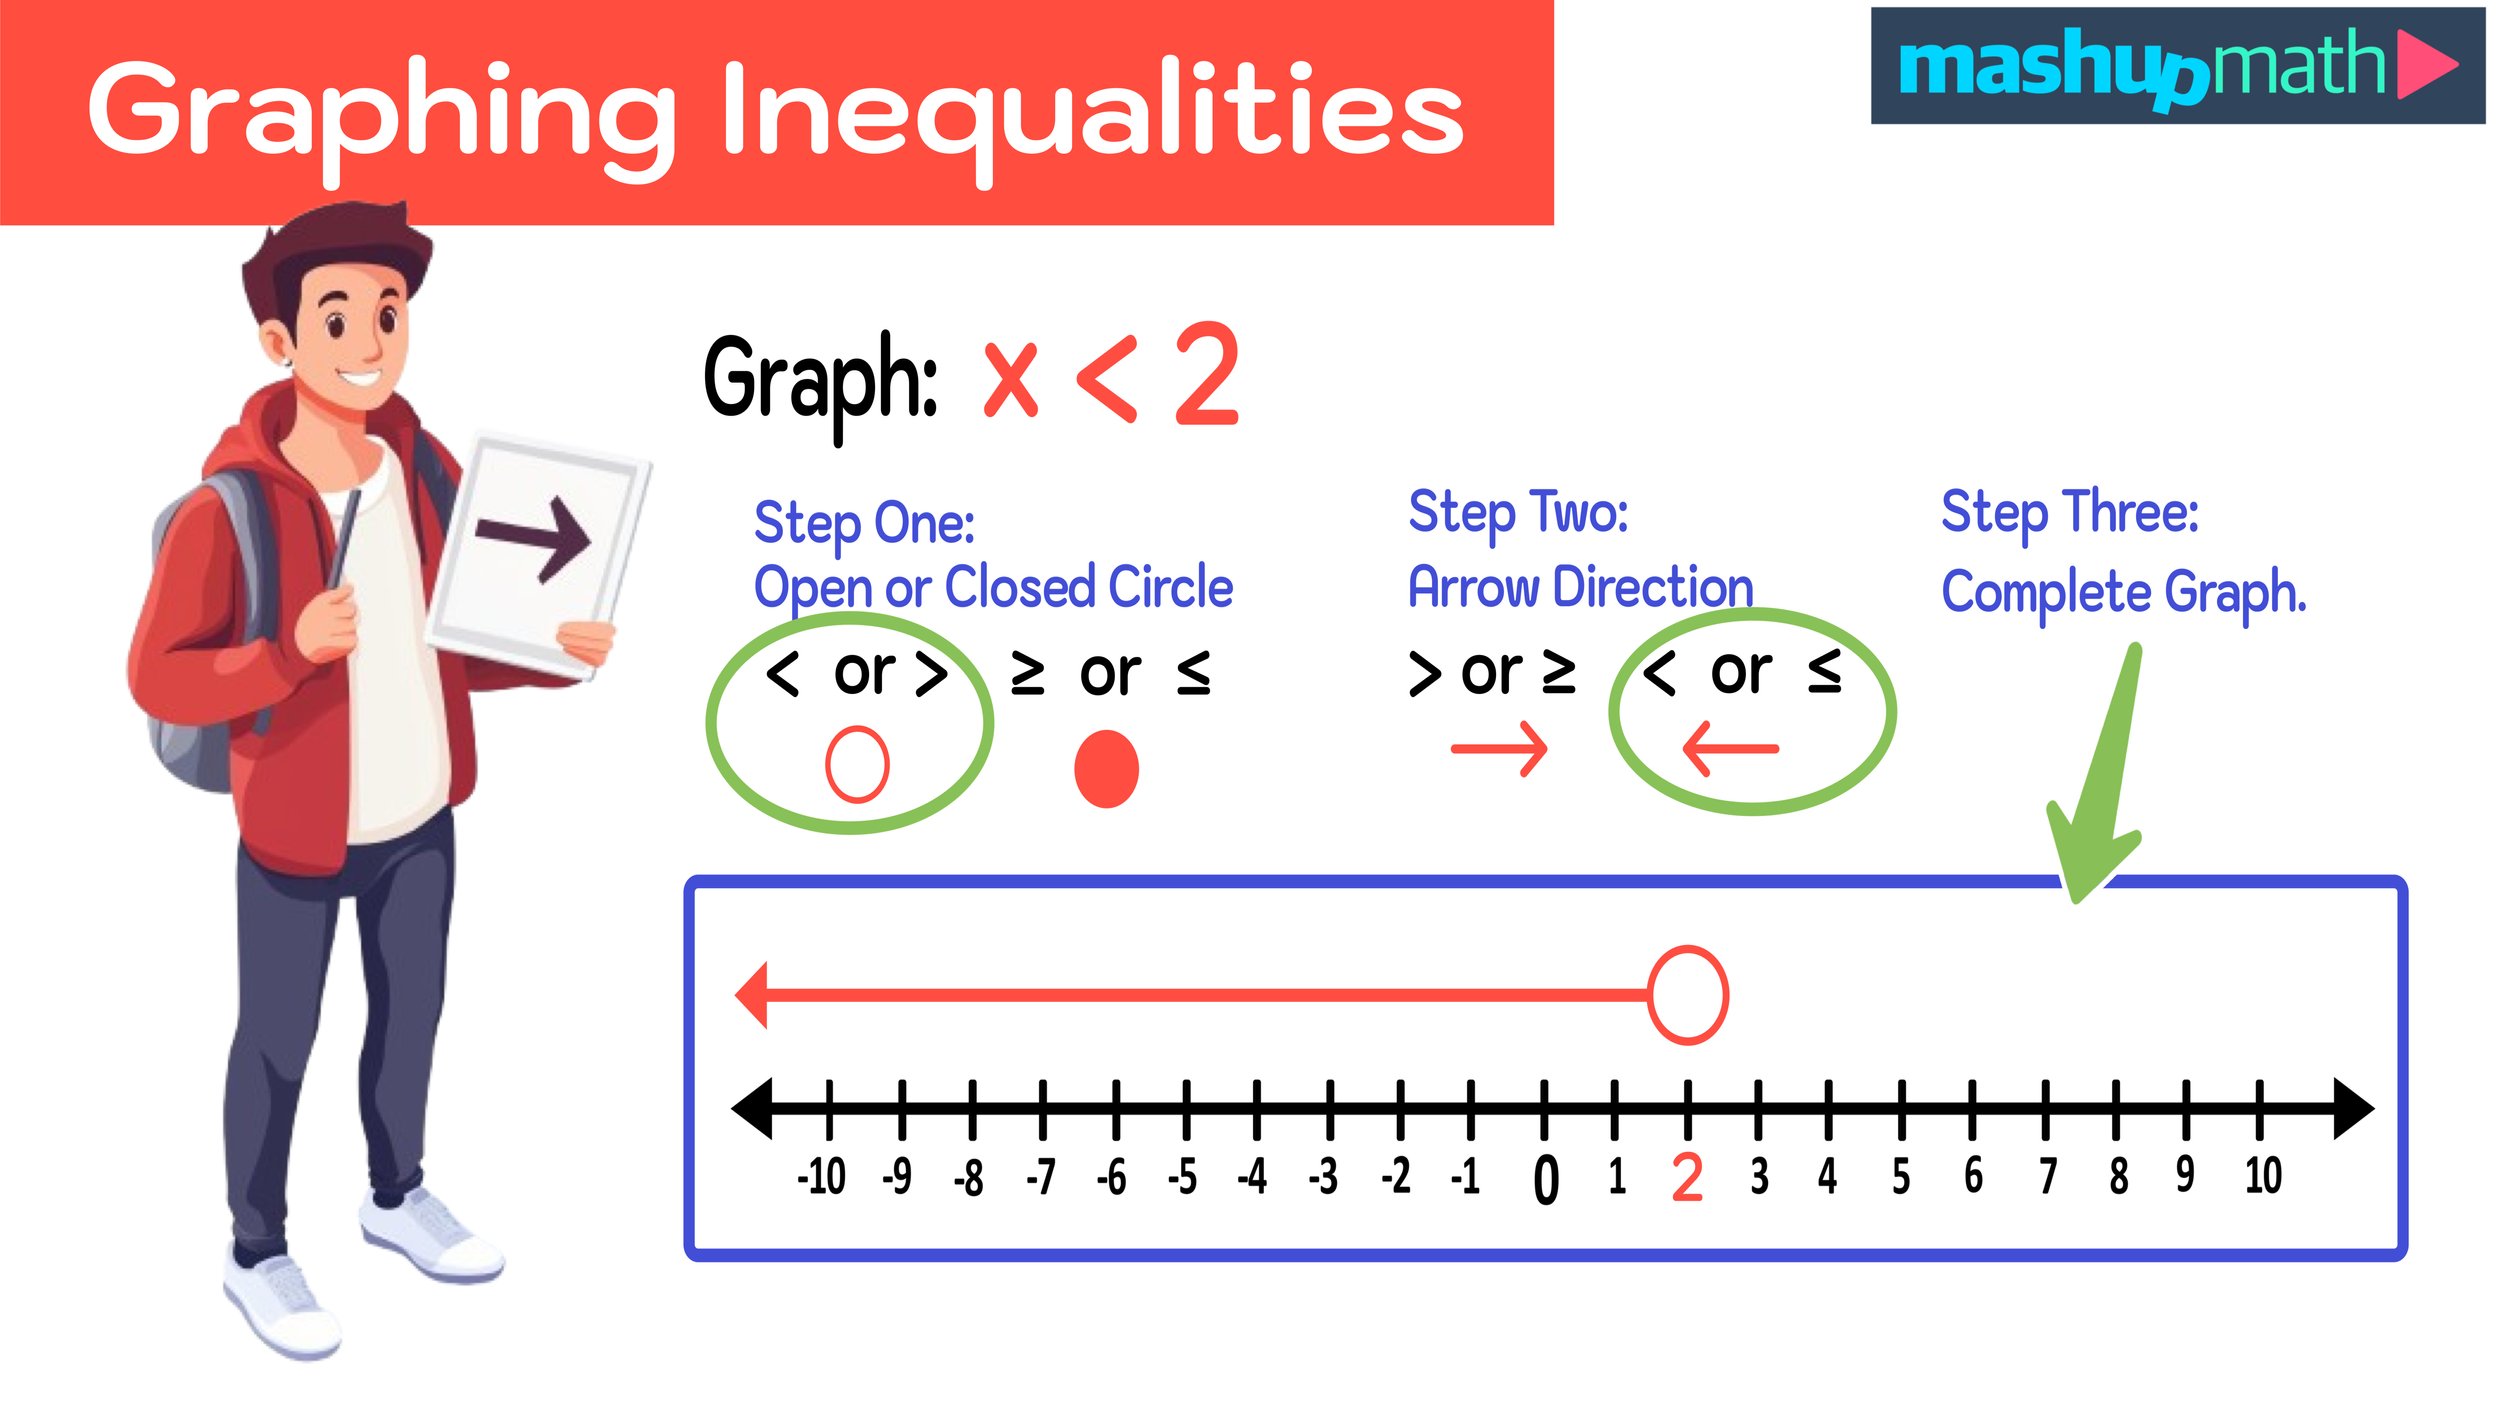
Example: Graph the following on a number line: x < 2

For this first example, and all of the examples in this guide, we will use our three-step process to successfully graph the inequality on a number line.

Step One: Determine whether the circle will be open or closed and plot it on the number line (< or > will be open; ≥ or ≤ will be closed).

Let’s start by determining whether our circle will be open or closed. Since the inequality in this example is <, our circle will be open.

  • The graph of the inequality x<2 will have an open circle.

Now we are ready for the next step.

Step Two: Make sure that the variable is on the left side of the inequality and determine the direction of the arrow (> or ≥ : arrow travels to the right: →; < or ≤: arrow travels to the left: ←)

Next, we have to determine the direction of the arrow. Since the variable is already on the left side of the inequality sign, we know that the inequality x<2 will travel to the left (←).

  • The graph of the inequality x<2 will have an arrow that travels to the left (←).

Let’s now move onto the third and final step.

Step Three: Draw your arrow and complete the graph.

Finally, we can draw our graph now that we have already determined that:

  • x < 2 has an open circle over 2 with an arrow traveling to the left

Our completed graph for Example #1 is illustrated in Figure 07 below.


Figure 07: Graphing Inequalities on a Number Line: Example #1 Solved


Now, let’s move onto our next example of how to graph inequalities on a number line.


How to Graph Solutions to Inequalities on a Number Line Example 2

Example: Graph the following on a number line: x ≥ 0

For this second example, we can again use of three-step process to graph the inequality on a number line.

Step One: Determine whether the circle will be open or closed and plot it on the number line (< or > will be open; ≥ or ≤ will be closed).

In this example, the inequality sign is ≥ (greater than or equal to), so our circle will be closed.

  • The graph of the inequality x ≥ 0 will have a closed circle.

Step Two: Make sure that the variable is on the left side of the inequality and determine the direction of the arrow (> or ≥ : arrow travels to the right: →; < or ≤: arrow travels to the left: ←)

Now we have to figure out which direction our arrow will travel from our closed circle. In this example, the variable is already on the left side of the inequality sign, so we can determine that the arrow for the graph of the inequality x ≥ 0 will travel to the right (→).

  • The graph of the inequality x ≥ 0 will have an arrow that travels to the right (→).

Step Three: Draw your arrow and complete the graph.

Now we have all of the information that we need to graph the inequality on a number line:

  • x ≥ 0 has a closed circle over 0 with an arrow traveling to the right

Figure 08 below illustrates what the completed graph of x ≥ 0 on a number line will look like.


Figure 08: How to graph inequalities on a number line: x ≥ 0 has a closed circle over zero on the number line with an arrow traveling from the center of the circle and to the right.


Graphing Inequalities on a Number Line Example 3

Example: Graph the following on a number line: -3 < x

We can again use our three-step method to solve our final example, where we have to graph the inequality -3 < x on a number line.

Step One: Determine whether the circle will be open or closed and plot it on the number line (< or > will be open; ≥ or ≤ will be closed).

For the inequality in Example #3, our inequality sign is <, which means that our graph will include an open circle.

  • The graph of the inequality -3 < x will have an open circle.

Now, let’s move onto the second step.

Step Two: Make sure that the variable is on the left side of the inequality and determine the direction of the arrow (> or ≥ : arrow travels to the right: →; < or ≤: arrow travels to the left: ←)

Unlike the first two examples, the inequality in Example #3 has the variable on the right side of the inequality sign: -3 < x

In order to determine the direction of our arrow, we have to “reverse” the order of the inequality equation as follows:

  • -3 < x → x > -3

Notice that, in addition to swapping the position of -3 and x, we also reversed the direction of the inequality sign:

  • < became >

*Whenever you “reverse” the order of an inequality equation to get the variable on the left side like we did in this example, you also have to reverse the direction of the inequality sign.

Now we are left with x > -3, so our variable is on the left side and we can conclude that the arrow for the graph of the inequality on a number line to the right (→).

  • The graph of the inequality x > -3 will have an arrow that travels to the right (→).

Step Three: Draw your arrow and complete the graph.

Finally, we can complete Example #3 by graphing the inequality on a number line using the following information that was collected from Steps One and Two:

  • x > -3 has an open circle over -3 with an arrow traveling to the right

The completed graph of the inequality x > -3 on a number line is shown in Figure 09 below.


Figure 09: Graphing Inequalities on a Number Line: x>-3


Conclusion: Graphing Inequalities on a Number Line

Unlike linear equations, which have only one possible solution, inequalities have an infinite amount of possible solutions. Graphing inequalities on a number line is a useful way to visualize the infinite amount of values in the solution sets of an inequality.

You can learn how to graph inequalities on a number line by following these three steps:

  • Step One: Determine whether the circle will be open or closed and plot it on the number line (< or > will be open; ≥ or ≤ will be closed).

  • Step Two: Make sure that the variable is on the left side of the inequality and determine the direction of the arrow (> or ≥ : arrow travels to the right: →; < or ≤: arrow travels to the left: ←)

  • Step Three: Draw your arrow and complete the graph.

As long as you can follow these three steps, you can successfully graph inequalities on a number line.

Keep Learning:

Free Blank Number Lines for All Grade Levels

Download free PDF number lines for all grade levels and topics.


1 Comment

How to Convert Percent to Decimal in 2 Easy Steps

Comment

How to Convert Percent to Decimal in 2 Easy Steps

How to Convert Percent to Decimal in 2 Easy Steps

Math Skills: How Do You Convert a Percent to Decimal?


Free Step-by-Step Guide: How to Convert Percent to Decimal


Every math student must learn and understand how to convert percent to decimal. This simple math skill has tons of practical applications both inside the classroom and in real life as well.

In this free guide to How to Convert Percent to Decimal, you will learn an easy two-step method for converting any percent into a decimal. Once you learn how to apply the two-steps, you will be able to quickly and accurately turn percents to decimals. The guide covers the following subtopics, and you can use the quick-links below to jump to a section of interest if you wish:

Once you work through the examples in this guide, you will have a strong understanding of how to turn percent to decimal in a variety of cases.

Are you ready to get started?


Lesson Preview: How to Convert Percent to Decimal Explained


How to Convert Percent to Decimal

We will begin this guide to converting percents into decimals by reviewing a few important vocabulary terms in reference to percentages and decimals.

Definition: In math, a percentage (or a percent) is a value or number that can be expressed as a fraction with where the denominator is 100. For example, 25% is equivalent to the fraction 25/100.

Definition: In math, a decimal is a value that represents a whole number with a fractional part. The fractional part will always have a denominator that is equal to 10 or a multiple of 10. For example, the decimal 0.8 is equal to the fraction 8/10.

Percents and decimals have a proportional relationship and they both can be used to represent a value. Whether you choose to express values as percents or as decimals often depends on the situation. Sometimes, it makes more sense to represent values as percents, and other times it is more useful to express values in decimal form. Given this relationship between percents and decimals, it is incredibly useful for you to be able to quickly and accurately convert between the two, especially converting a percent to decimal.


Figure 01: How to Convert Percent to Decimal: 85% converted to a decimal is 0.85


How to Convert Percent to Decimal in 2 Steps

Now that we have reviewed the key vocabulary terms and relationships related to percents and decimals, we are ready to learn how to turn percent to decimal by following two simple steps:

  • Step One: Rewrite the percent without the % symbol

  • Step Two: Add a decimal point (if there isn’t one already) and shift it two places to the left

If you can learn how to apply these two simple step s, you will be able to successfully convert any percent into a decimal number.

For example, let’s apply these two steps to converting 85% into a decimal number.

Step One: Rewrite the percent without the % symbol

For the first step, we simply have to take the percentage value and rewrite it without the % symbol as follows:

  • 85% → 85

Now we can move onto Step Two.

Step Two: Add a decimal point (if there isn’t one already) and shift it two places to the left

For the second step, we have to see if the result from Step One has a decimal point. If it doesn’t already have one, we have to add one. Then, we just have to take that decimal point and shift it two units to the left as follows:

  • 85 → 85.0

  • 85.0 → .85 → 0.85

Final Answer: 85% = 0.85

That’s all that there is to it!


Figure 02: You can convert a percent to decimal by shifting the decimal place two places to the left.


Ready to gain some more experience with using our two-step method for how to turn percent to decimal? Let’s move onto the next section where we will work through five different examples.


How Do You Convert a Percent to Decimal?

Convert Percent to Decimal Example #1

Example: Convert 40% to a decimal.

For Example #1, we have to convert 40% to a decimal number. We can solve this problem by following our two-step method as follows:

Step One: Rewrite the percent without the % symbol

We can complete Step One by rewriting 40% without a percentage symbol as follows:

  • 40% → 40

Step Two: Add a decimal point (if there isn’t one already) and shift it two places to the left

Since our result from Step One, 40, doesn’t have a decimal point, we have to add one and then move it two places to the left as follows:

  • 40 → 40.0

  • 40.0 → .4 → 0.4

Final Answer: 40% = 0.4

We have now solved the first example and we can say that 40% is equal to 0.4.

Figure 03 below illustrates how we used our two-step method to solve this first problem.


Figure 03: How to Convert Percent to Decimal: 40% = 0.4


Are you ready to try another example?


Convert Percent to Decimal Example #2

Example: Convert 79% to a decimal.

For this next example, we can again use our two-step method for converting percents to decimals as follows:

Step One: Rewrite the percent without the % symbol

Just like the last example, we start off by rewriting the percent value without the % symbol as follows:

  • 79% → 79

Step Two: Add a decimal point (if there isn’t one already) and shift it two places to the left

Since 79 does not have a decimal point, we have to add one and then shift it to the left two places.

  • 79 → 79.0

  • 79.0 → .79 → 0.79

Final Answer: 79% = 0.79

So, we can conclude that 79% is equal to 0.79.

Figure 04 displays how we solved Example #2.


Figure 04: How do you convert a percent to decimal?


Convert Percent to Decimal Example #3

Example: Convert 3% to a decimal.

Are you starting to get the hang of it? Let’s move onto to this third example, where we have to convert 3% into a decimal value.

Step One: Rewrite the percent without the % symbol

Start off by rewriting 3% without the percentage symbol:

  • 3% → 3

Step Two: Add a decimal point (if there isn’t one already) and shift it two places to the left

 
3% = 0.03

3%=0.03


Next, we have to add a decimal point and then shift it two places to the left as follows:

  • 3 → 3.0

  • 3.0 → .03 → 0.03

Final Answer: 3% = 0.03

Finally, we can conclude that 3% is equal to 0.03.

The entire step-by-step process for converting this percent to decimal is shown in Figure 05 below.


Figure 05: How to Turn Percent to Decimal: 3% = 0.03


Convert Percent to Decimal Example #4

Example: Convert 6.2% to a decimal.

For this fourth example, we are dealing with a percentage that includes a decimal. Luckily, we can still use our two-step method to convert to percent to a decimal.

Step One: Rewrite the percent without the % symbol

Just like the previous examples, our first step is to rewrite the percent without the % sign.

  • 6.2% → 6.2

Step Two: Add a decimal point (if there isn’t one already) and shift it two places to the left


6% = 0.062


In this case, we don’t have to add a decimal because there already is one (between 6 and 2 in 6.2). So, we just have to take that decimal point and shift it two places to the left as follows:

  • 6.2 → .062 → 0.062

Final Answer: 6.2% = 0.062

The entire step-by-step process for converting this percent to decimal is shown in Figure 06 below.


Figure 06: How to Convert Percent to Decimal Example #4


Convert Percent to Decimal Example #5

Example: Convert 115% to a decimal.

For our fifth and final example, we have to convert a percent that is great than 100% into a decimal. Even in situations like, we can still use our two-step method to accurately convert the percent to decimal.

Step One: Rewrite the percent without the % symbol

Just like all of the previous examples, we start out by rewriting 115% without the percent symbol as follows:

  • 115% → 115

Step Two: Add a decimal point (if there isn’t one already) and shift it two places to the left


115% = 1.15


To complete Step Two, we just have to add a decimal point at the end 115 and then shift it two places to the left as follows:

  • 115 → 115.0

  • 115.0 → 1.150 → 1.15

Note that we don’t have to include the zero at the end of 1.150 and we can conclude that:

Final Answer: 115% = 1.15

All of the steps that were followed to complete this last example are shown in Figure 07 below.


Figure 07: How to convert percent to decimal when the percent is greater than 100.


Conclusion: How to Convert Percent to Decimal

Being able to quickly and accurately convert a percent to a decimal is an important and useful math skill that every student must master.

You can successfully convert any percent into a decimal by following two simple steps:

  • Step One: Rewrite the percent without the % symbol

  • Step Two: Add a decimal point (if there isn’t one already) and shift it two places to the left

In this guide on how to turn percent to decimal, we worked through five step-by-step examples where we made the following conversions:

  • 40% = 0.4

  • 79% = 0.79

  • 3% = 0.03

  • 6.2% = 0.062

  • 115% = 1.15

Keep Learning:


Comment