How to Boost Student Engagement with Math Pictures
Teachers can us math pictures to spark deep discussions and make mathematics more visually accessible for students

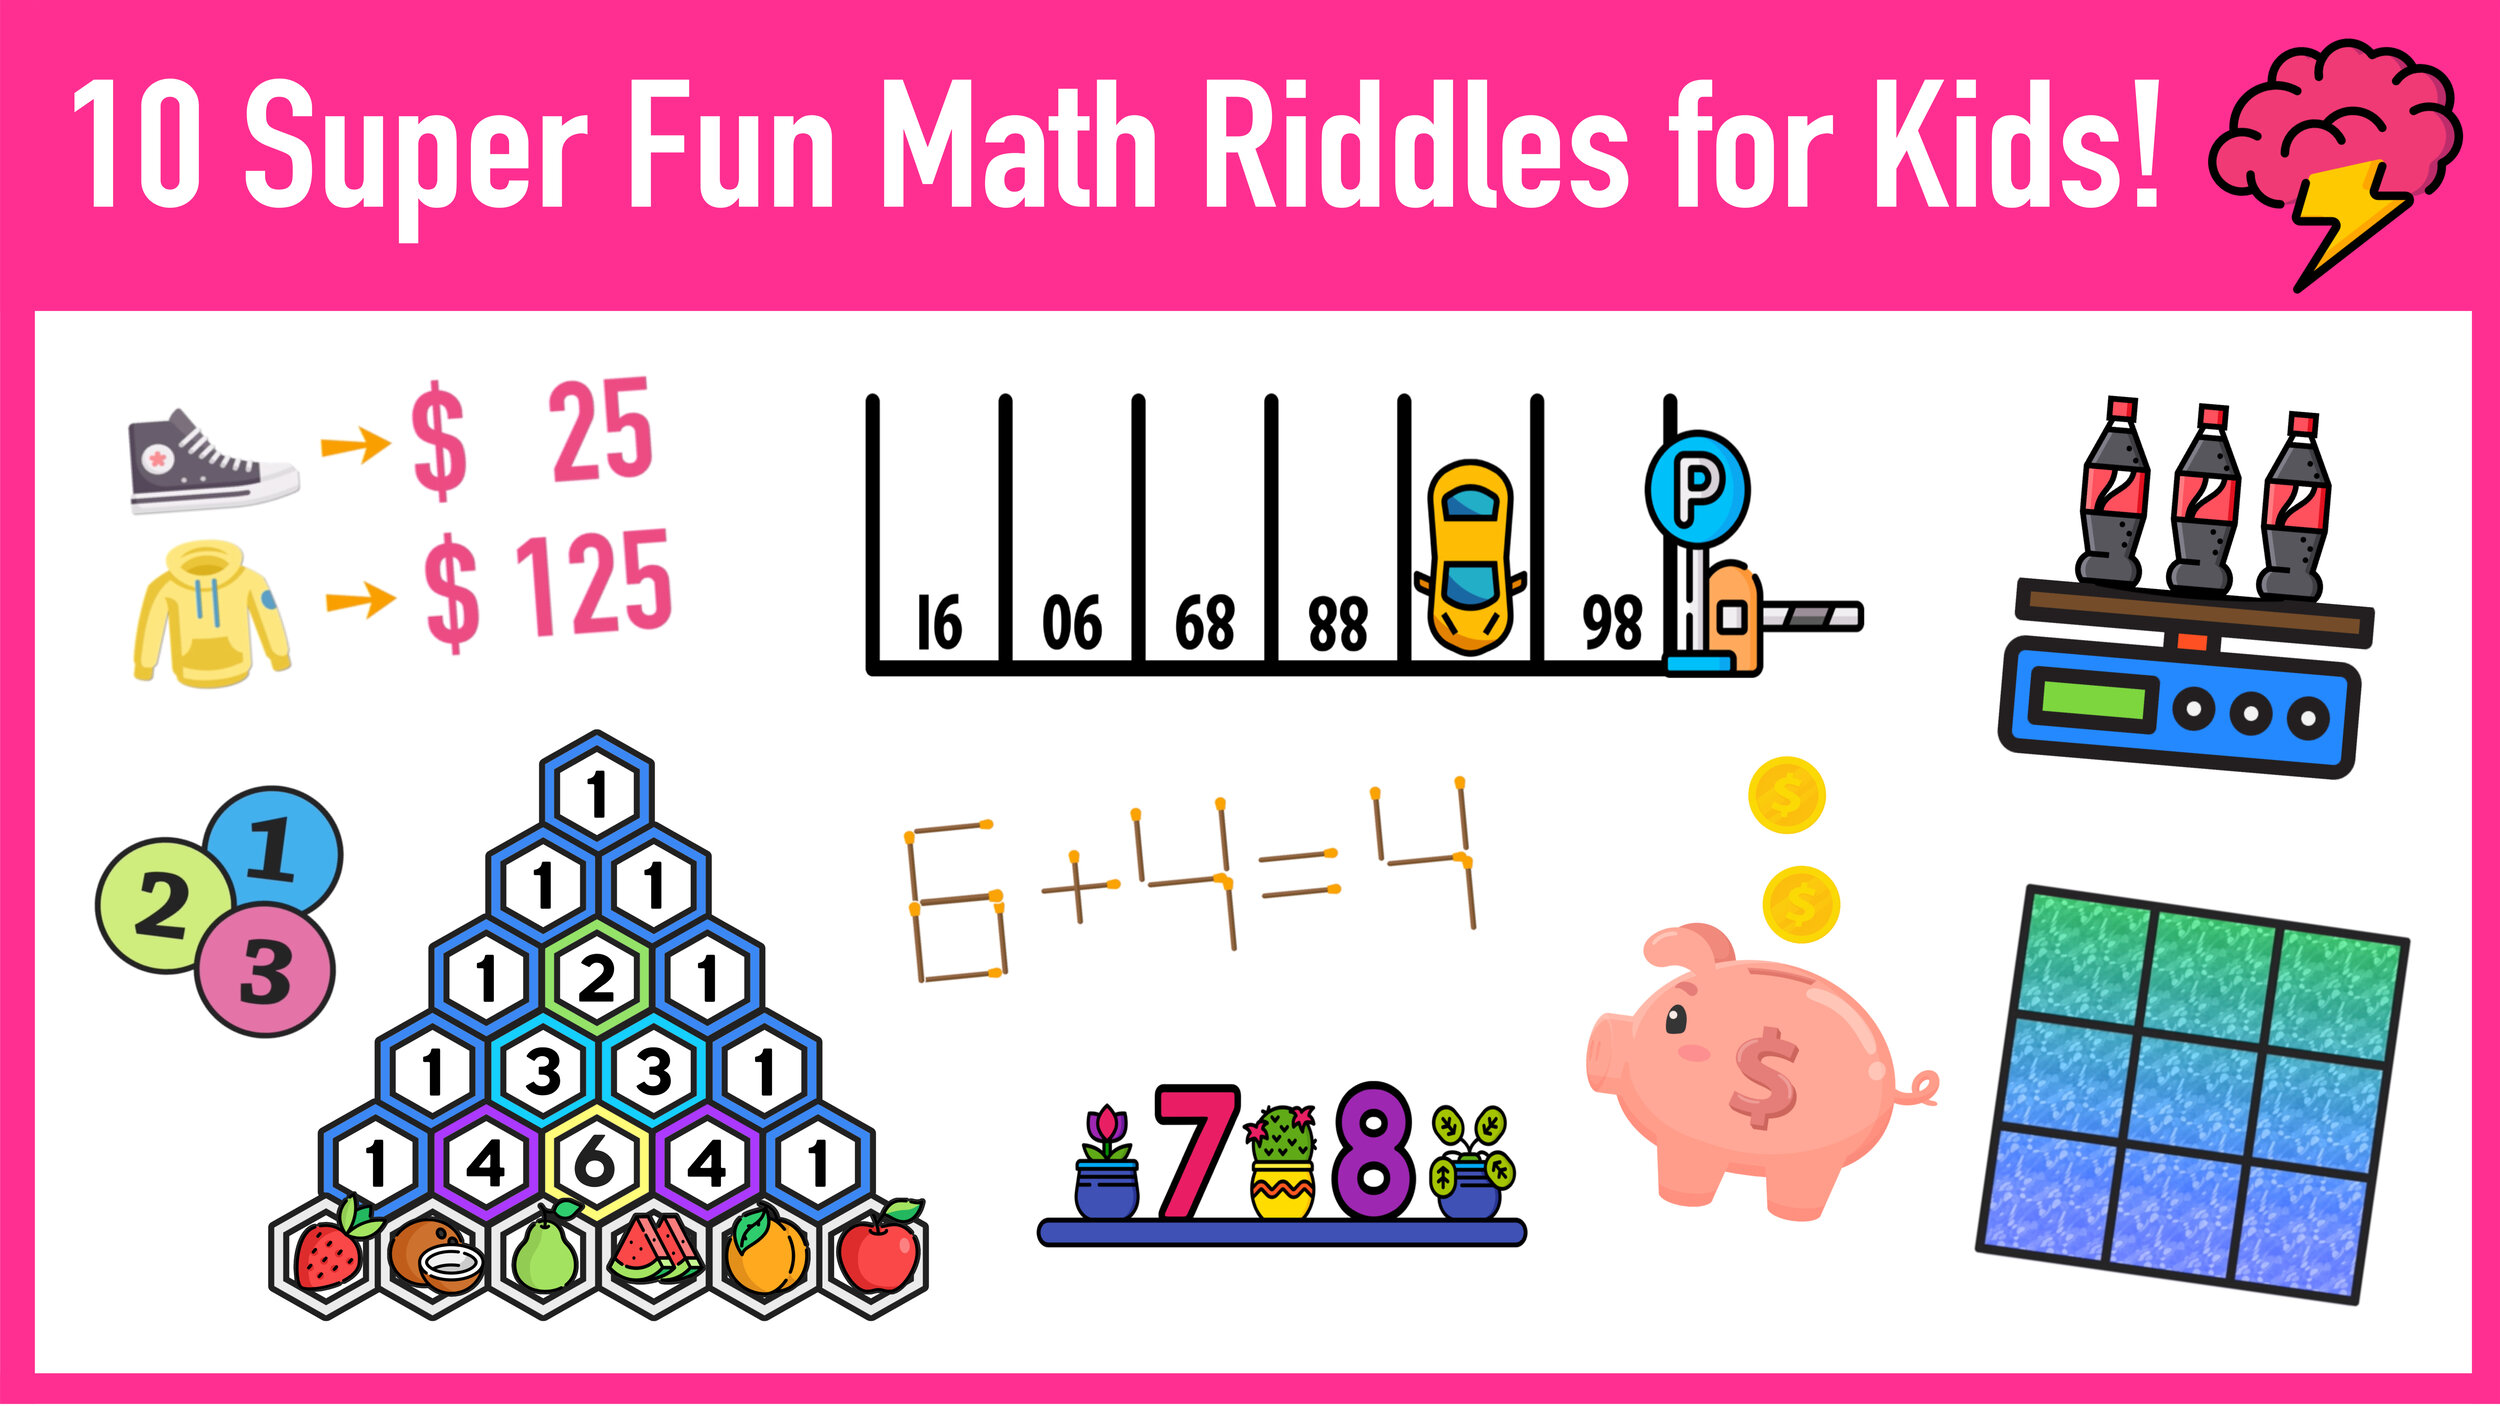
Math Pictures can be used to spark student interest and discussion for a variety of topics.
Mathematics is a visual subject, and math pictures are an important tool for understanding and communicating mathematical ideas. Math pictures help us see patterns, visualize concepts, and explore relationships.
In this post, we will explore the world of math pictures in several forms including:
Math Pictures: Graphs and Diagrams
Graphs and diagrams are perhaps the most common type of pictures for math applications. These visual aids are used to represent real-world data in a visual way that is easy to understand. Graphs can show relationships between variables, patterns in data, and trends over time. There are many different types of graphs, including line graphs, bar graphs, scatter plots, and pie charts.

Picture Math: Graphs and charts are one of the most common types of visual math representations. (Image: Mashup Math FP)
Line graphs are used to show how a variable changes over time or in relation to another variable. For example, a line graph might show how the temperature changes throughout the day, or how the stock price of a company changes over the course of a year. Bar graphs are used to compare different categories of data, such as the sales of different products or the number of students in different grade levels. Scatter plots are used to show how two variables are related to each other, such as the relationship between height and weight. Pie charts are used to show how a whole is divided into parts, such as the percentage of a budget that is spent on different categories.
Diagrams are another type of math pictures that can be used to represent relationships between concepts. Venn diagrams, for example, are used to show how sets overlap or do not overlap. Flowcharts are used to show the steps in a process or algorithm. Tree diagrams are used to show the outcomes of different choices or events.

Pictures of Math: Venn Diagrams
(Image: Mashup Math)

Compare/Contrast Colors
(Image: Mashup Math FP)
Math Pictures: Think-Notice-Wonder
Encouraging students to write about math facilitates the structuring of their thoughts, utilization of crucial terminology, and effective mathematical communication, ultimately resulting in a profound and significant comprehension of the subject.
When you look at this math picture, what do you think? What do you notice? What do you wonder?
A recent trend in math education is the use of captivating think-notice-wonder (TNW) writing prompts to spark student thinking and participation.
TNW activities involve presenting students with a math picture along with a prompt to complete the following statements in writing:
I Think…
I Notice…
I Wonder…
You can learn more about using TNW activities in your classroom by clicking here.

Math Pictures: Think-Notice-Wonder Writing Prompts
Math Pictures: Art and Visualizations
Mathematical art combines the beauty of art with the precision of mathematics. One incredible example of mathematical art are Lissajous figures that are made using a Harmonograph—a mechanical device that uses a pendulum to draw a geometric math picture. Some of the most beautiful Lissajous figures can be found out the Exploratorium Museum in San Francisco, California, where several works by Ivan Moscovich are on display.

Math Pictures: Harmonographs
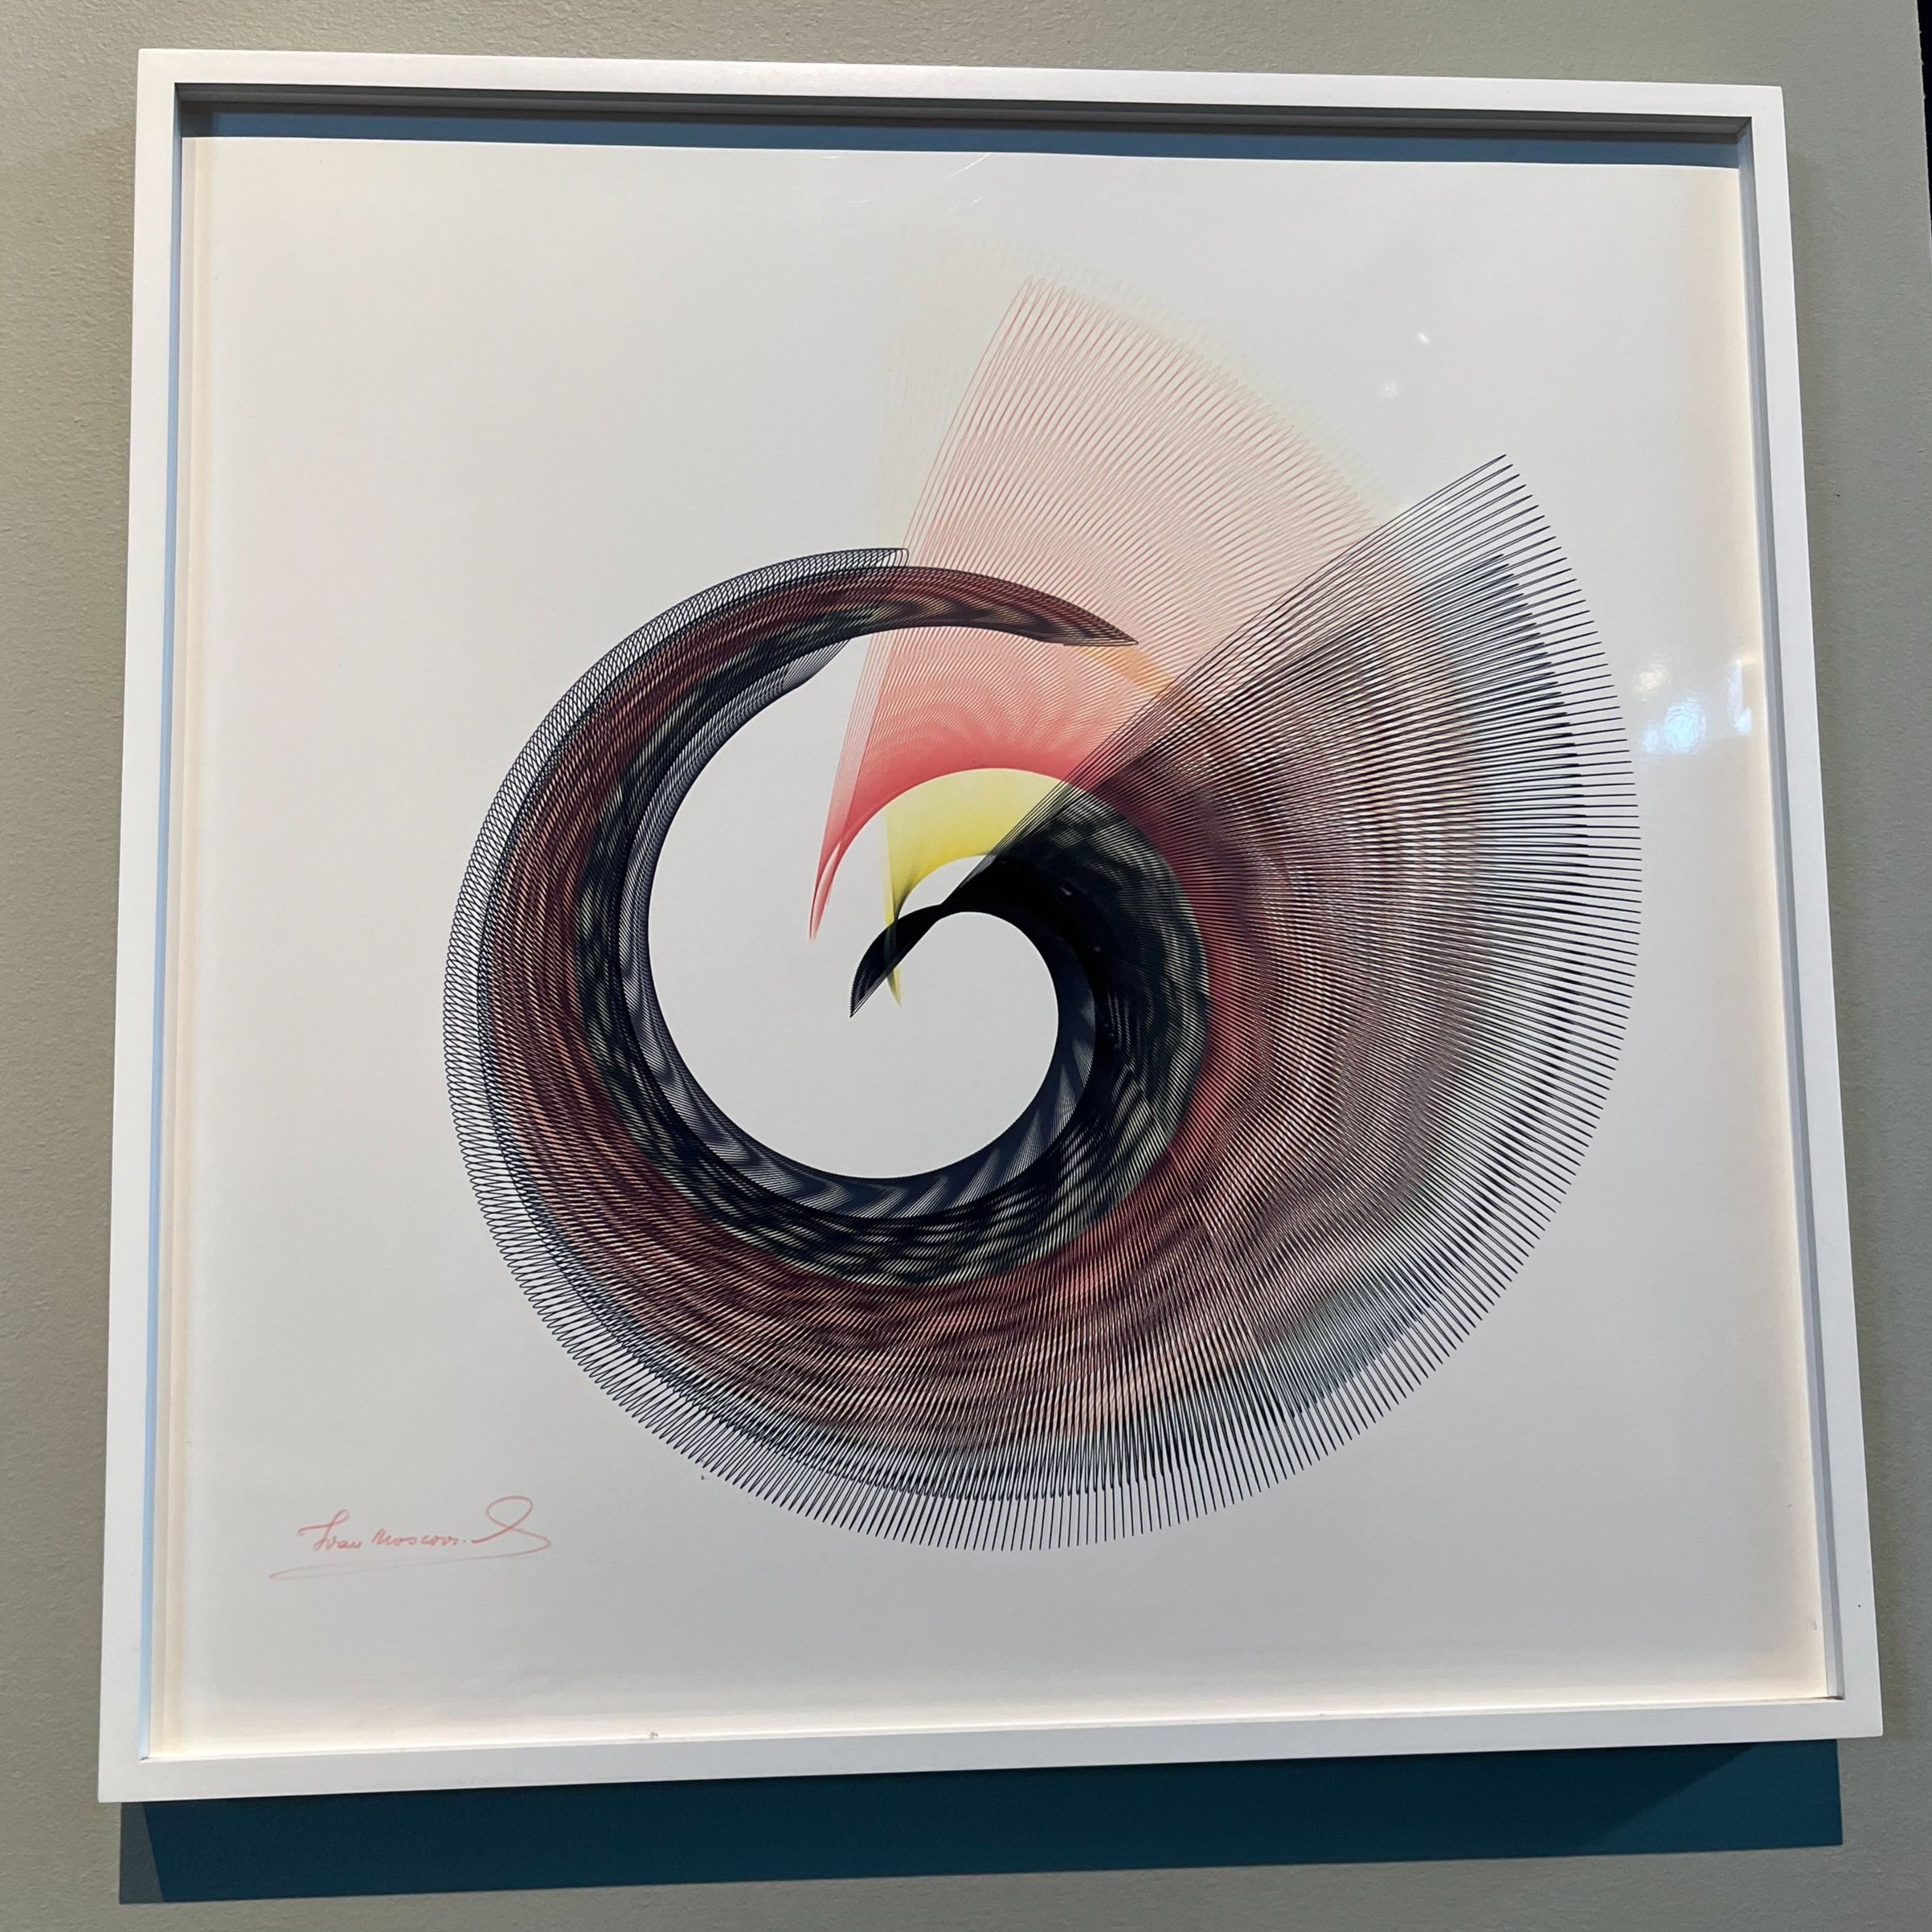
Math Pictures: Harmonographs

Math Pictures: Harmonographs
Another example of art-related pictures for math learning are Escher tessellations, which are repeating patterns that are created by fitting different shapes together in a precise way.

Math Pictures: Escher Tessellations (Digital)
Image: Mashup Math FP

Mathematical visualizations are yet another type of math picture that is used to help us understand complex mathematical concepts. Visualizations use color, shape, and movement to represent mathematical objects and relationships. They are often used in fields such as physics, computer science, architecture, and engineering to help researchers understand and model complex systems.


Another example of pictures for math visualization is a heat map. Heat maps are used to show how a variable changes over time or space. For example, a heat map might show how the temperature changes throughout a city or how the stock prices of different companies change over the course of a day. Another example is a network diagram, which is used to show how different nodes or points are connected to each other. Network diagrams are used in fields such as social science and computer science to model complex systems of relationships.
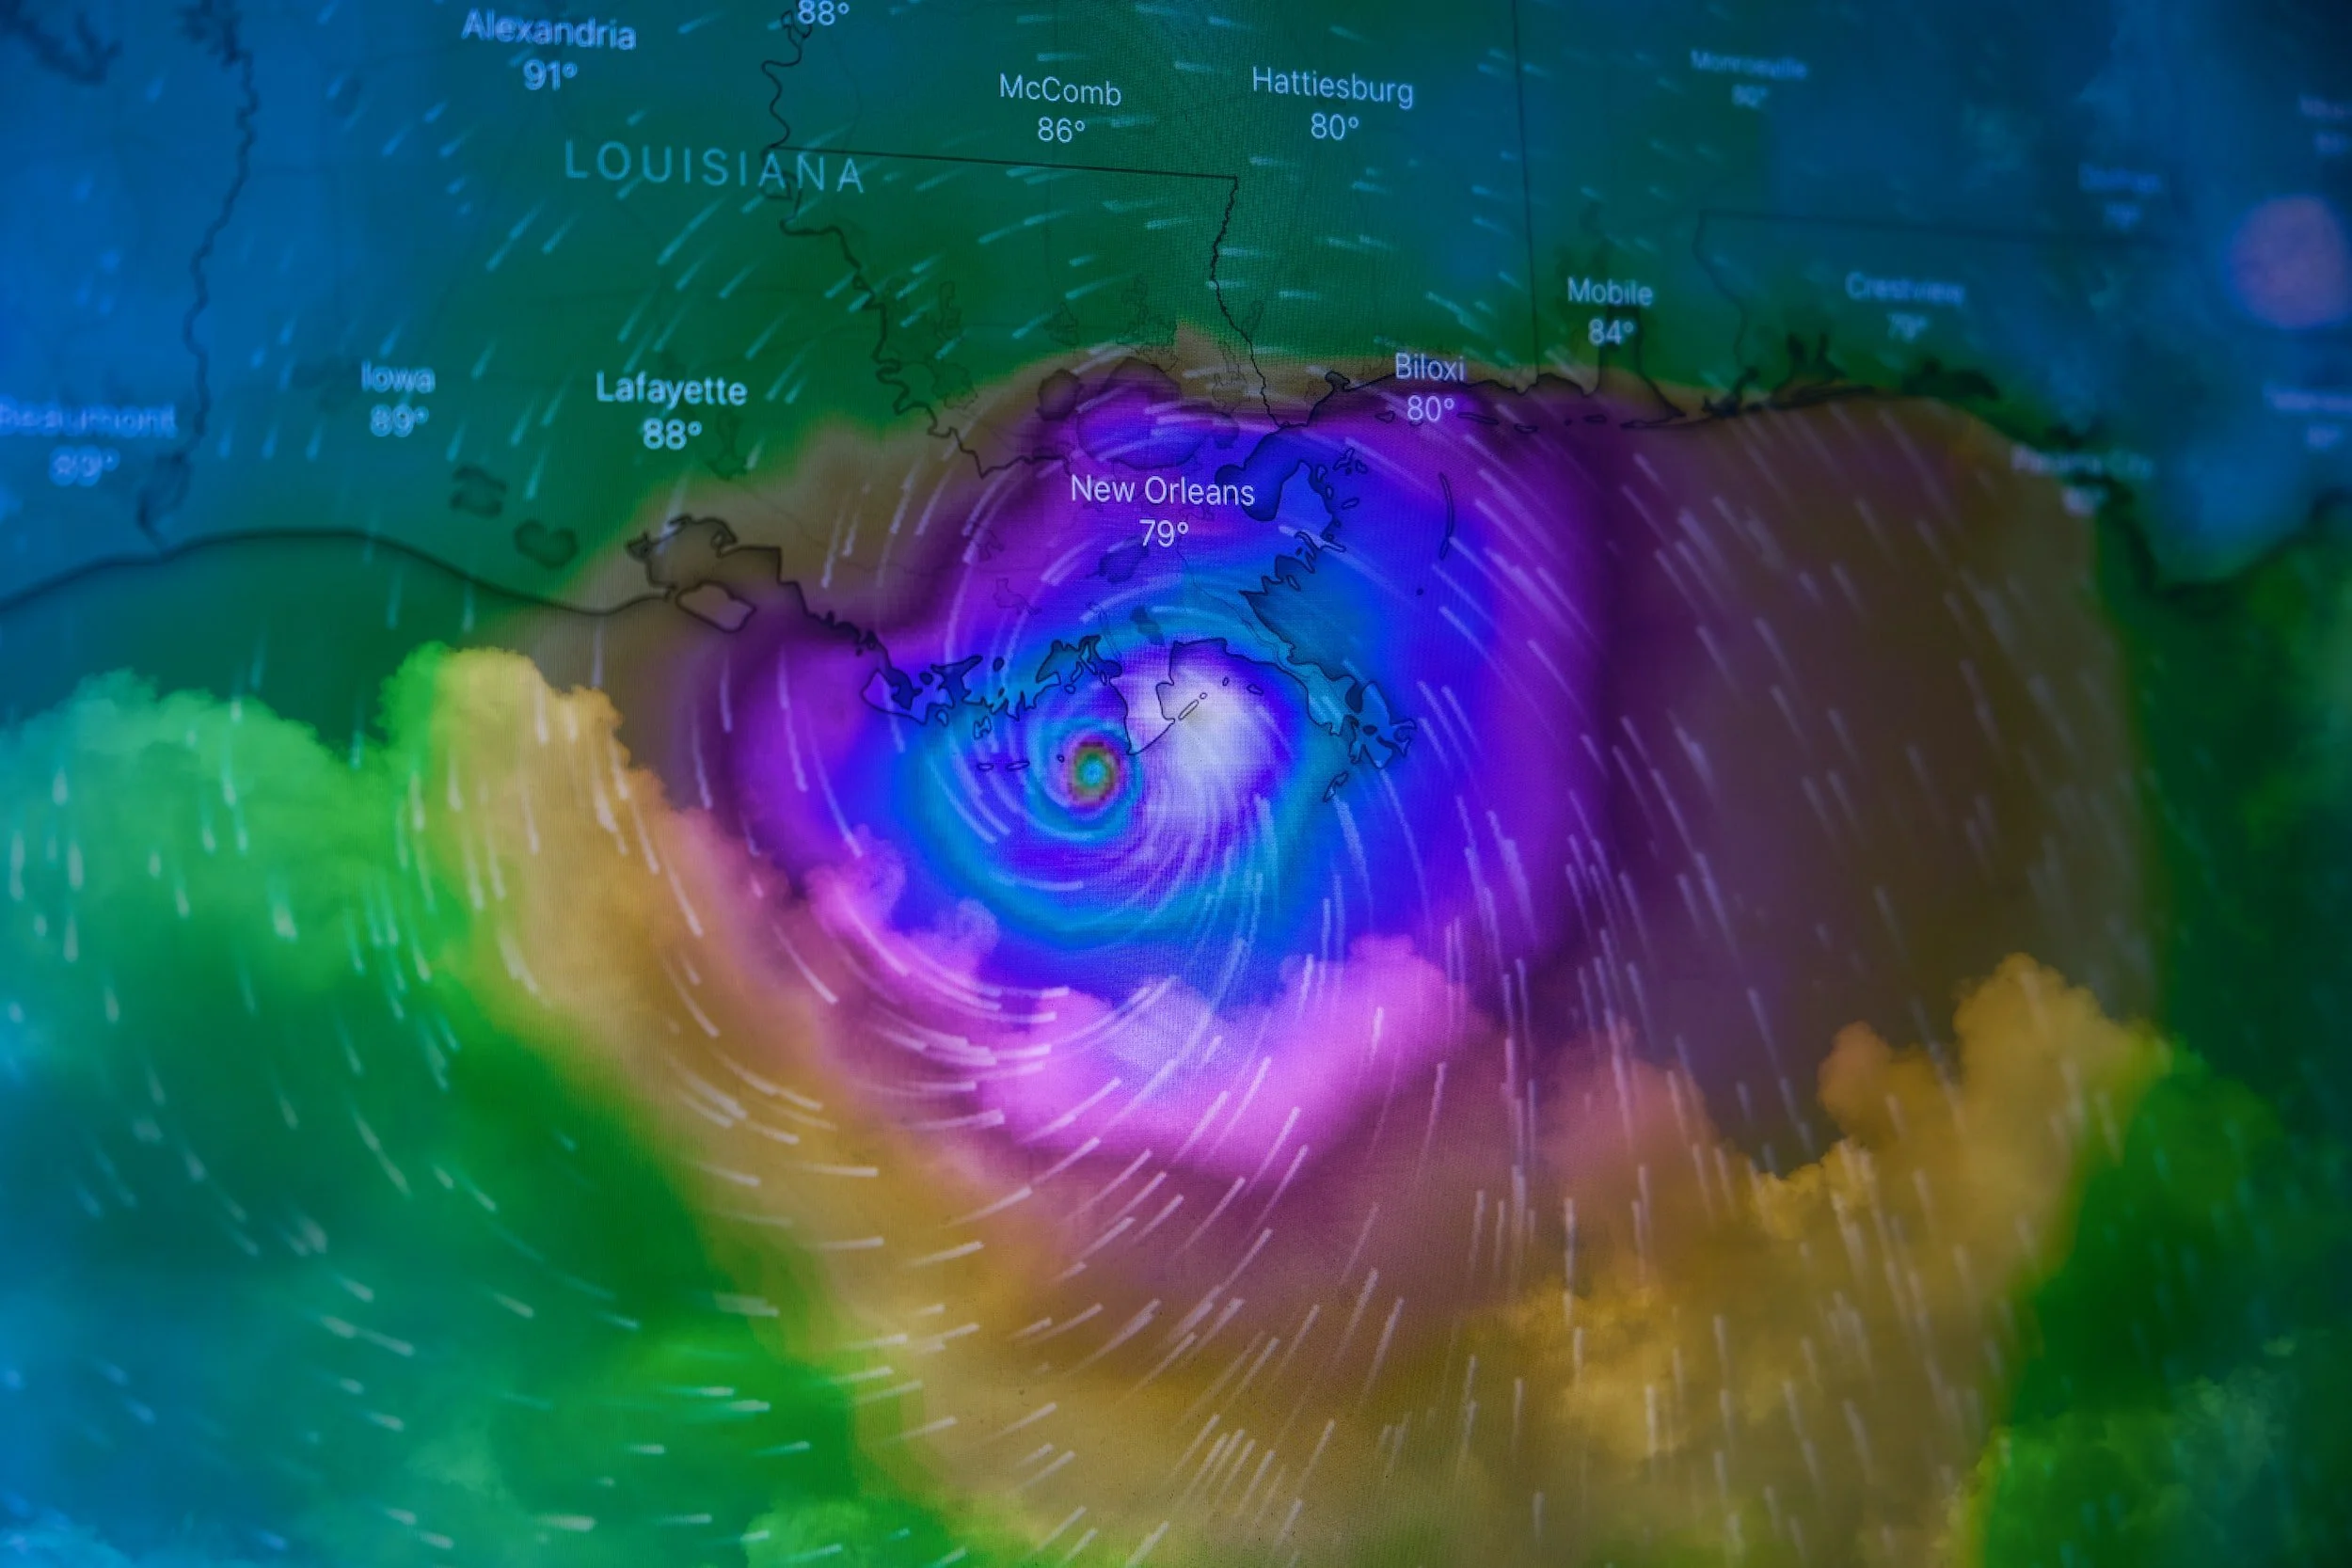
Pictures of Math: Weather Heat Maps (Photo by Brian McGowan on Unsplash)
Math Pictures: Topic-Specific Examples
Mathematical pictures are not just useful for professionals and researchers; they can also be used to help students understand difficult concepts. In fact, many math teachers use pictures and diagrams to help their students learn math.
For example, a teacher might use a picture of a number line to help students understand how numbers relate to each other. Here a few more ideas for using math pictures to engage students when learning specific topics:

Math Pictures: The common medical pain scale chart is also a number line!
(Image: Mashup Math FP)
Here are a few more topic-specific examples of math pictures that you can use to engage your students:
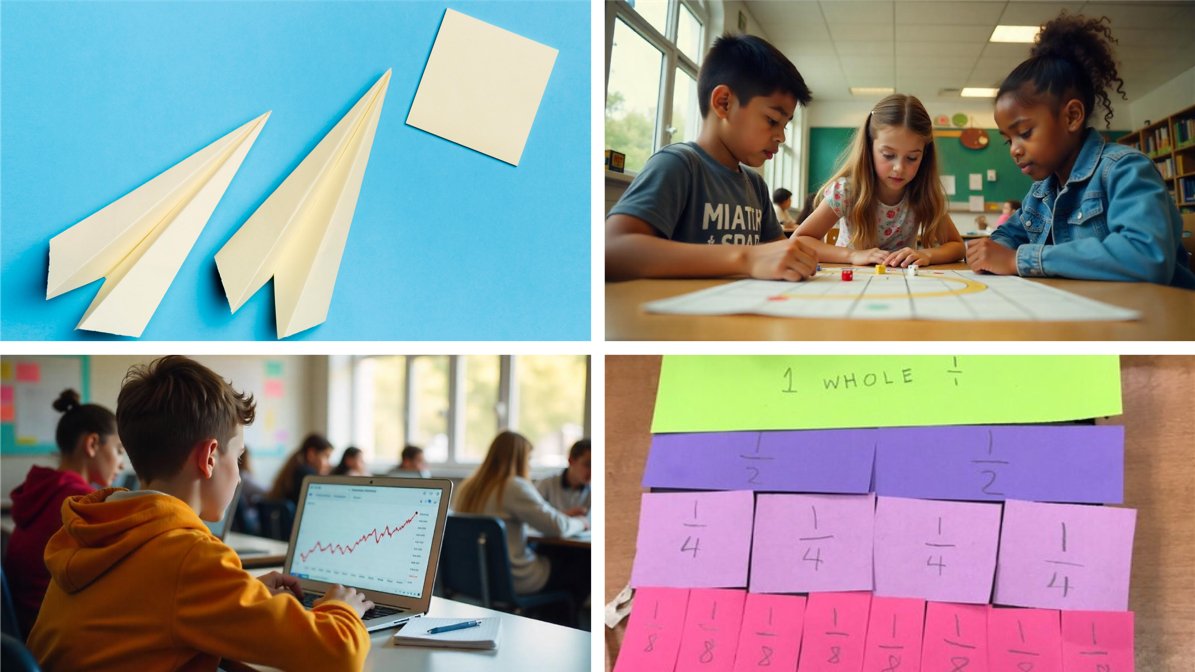
Fractions: Fractions can be one of the most challenging topics for students to grasp. Teachers can use various math pictures to give students a visual way to think about fractions and what they represent.
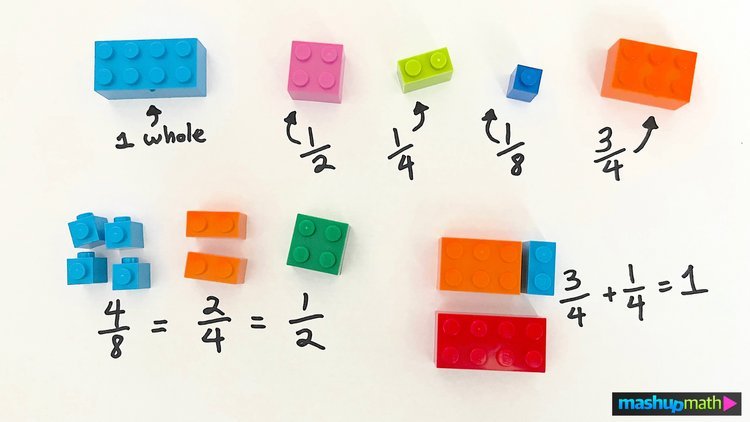
Relating Fractions to Legos

Exploring parts and wholes with avocados.
Percents: Like fractions, percents can be a tricky topic for students and using visual math pictures is a great way to help students think more creatively about percentages.
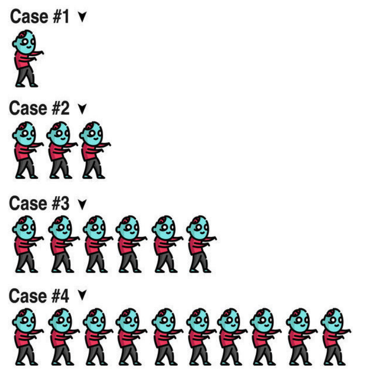
Probability: Another math topic that can be highly visual and enhanced by the use of math pictures is probability. In this case, using math pictures that utilize fun and interesting scenarios is a great way to spark student engagement and interest in applying their math skills to making predictions about what will happen next.
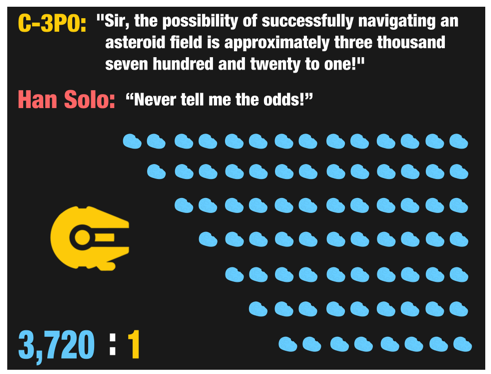
Using pictures of math to explore probability.
Money: When teaching students about money and spending, using math pictures that bring relatable scenarios to life is a no brainer.

Math Pictures: Bring money scenarios to life with visual aids.
Geometric Shapes: Teachers can also use math pictures to supplement any lesson on 2D and/or 3D-geometric shapes and their properties.

Math Pictures: Geometric Shapes in Art
Photo by Clément Falize on Unsplash

Math Pictures: Geometric Shapes in Sculpture
(Image: Mashup Math FP)
There are many places online to search for math pictures including Google Images and free online stock photo galleries such as Unsplash.
Regardless of the source of the math pictures, your students will be enthusiastic and interested in discussing them, as mathematics is present in our surroundings.
More Teaching Insights Just for You: