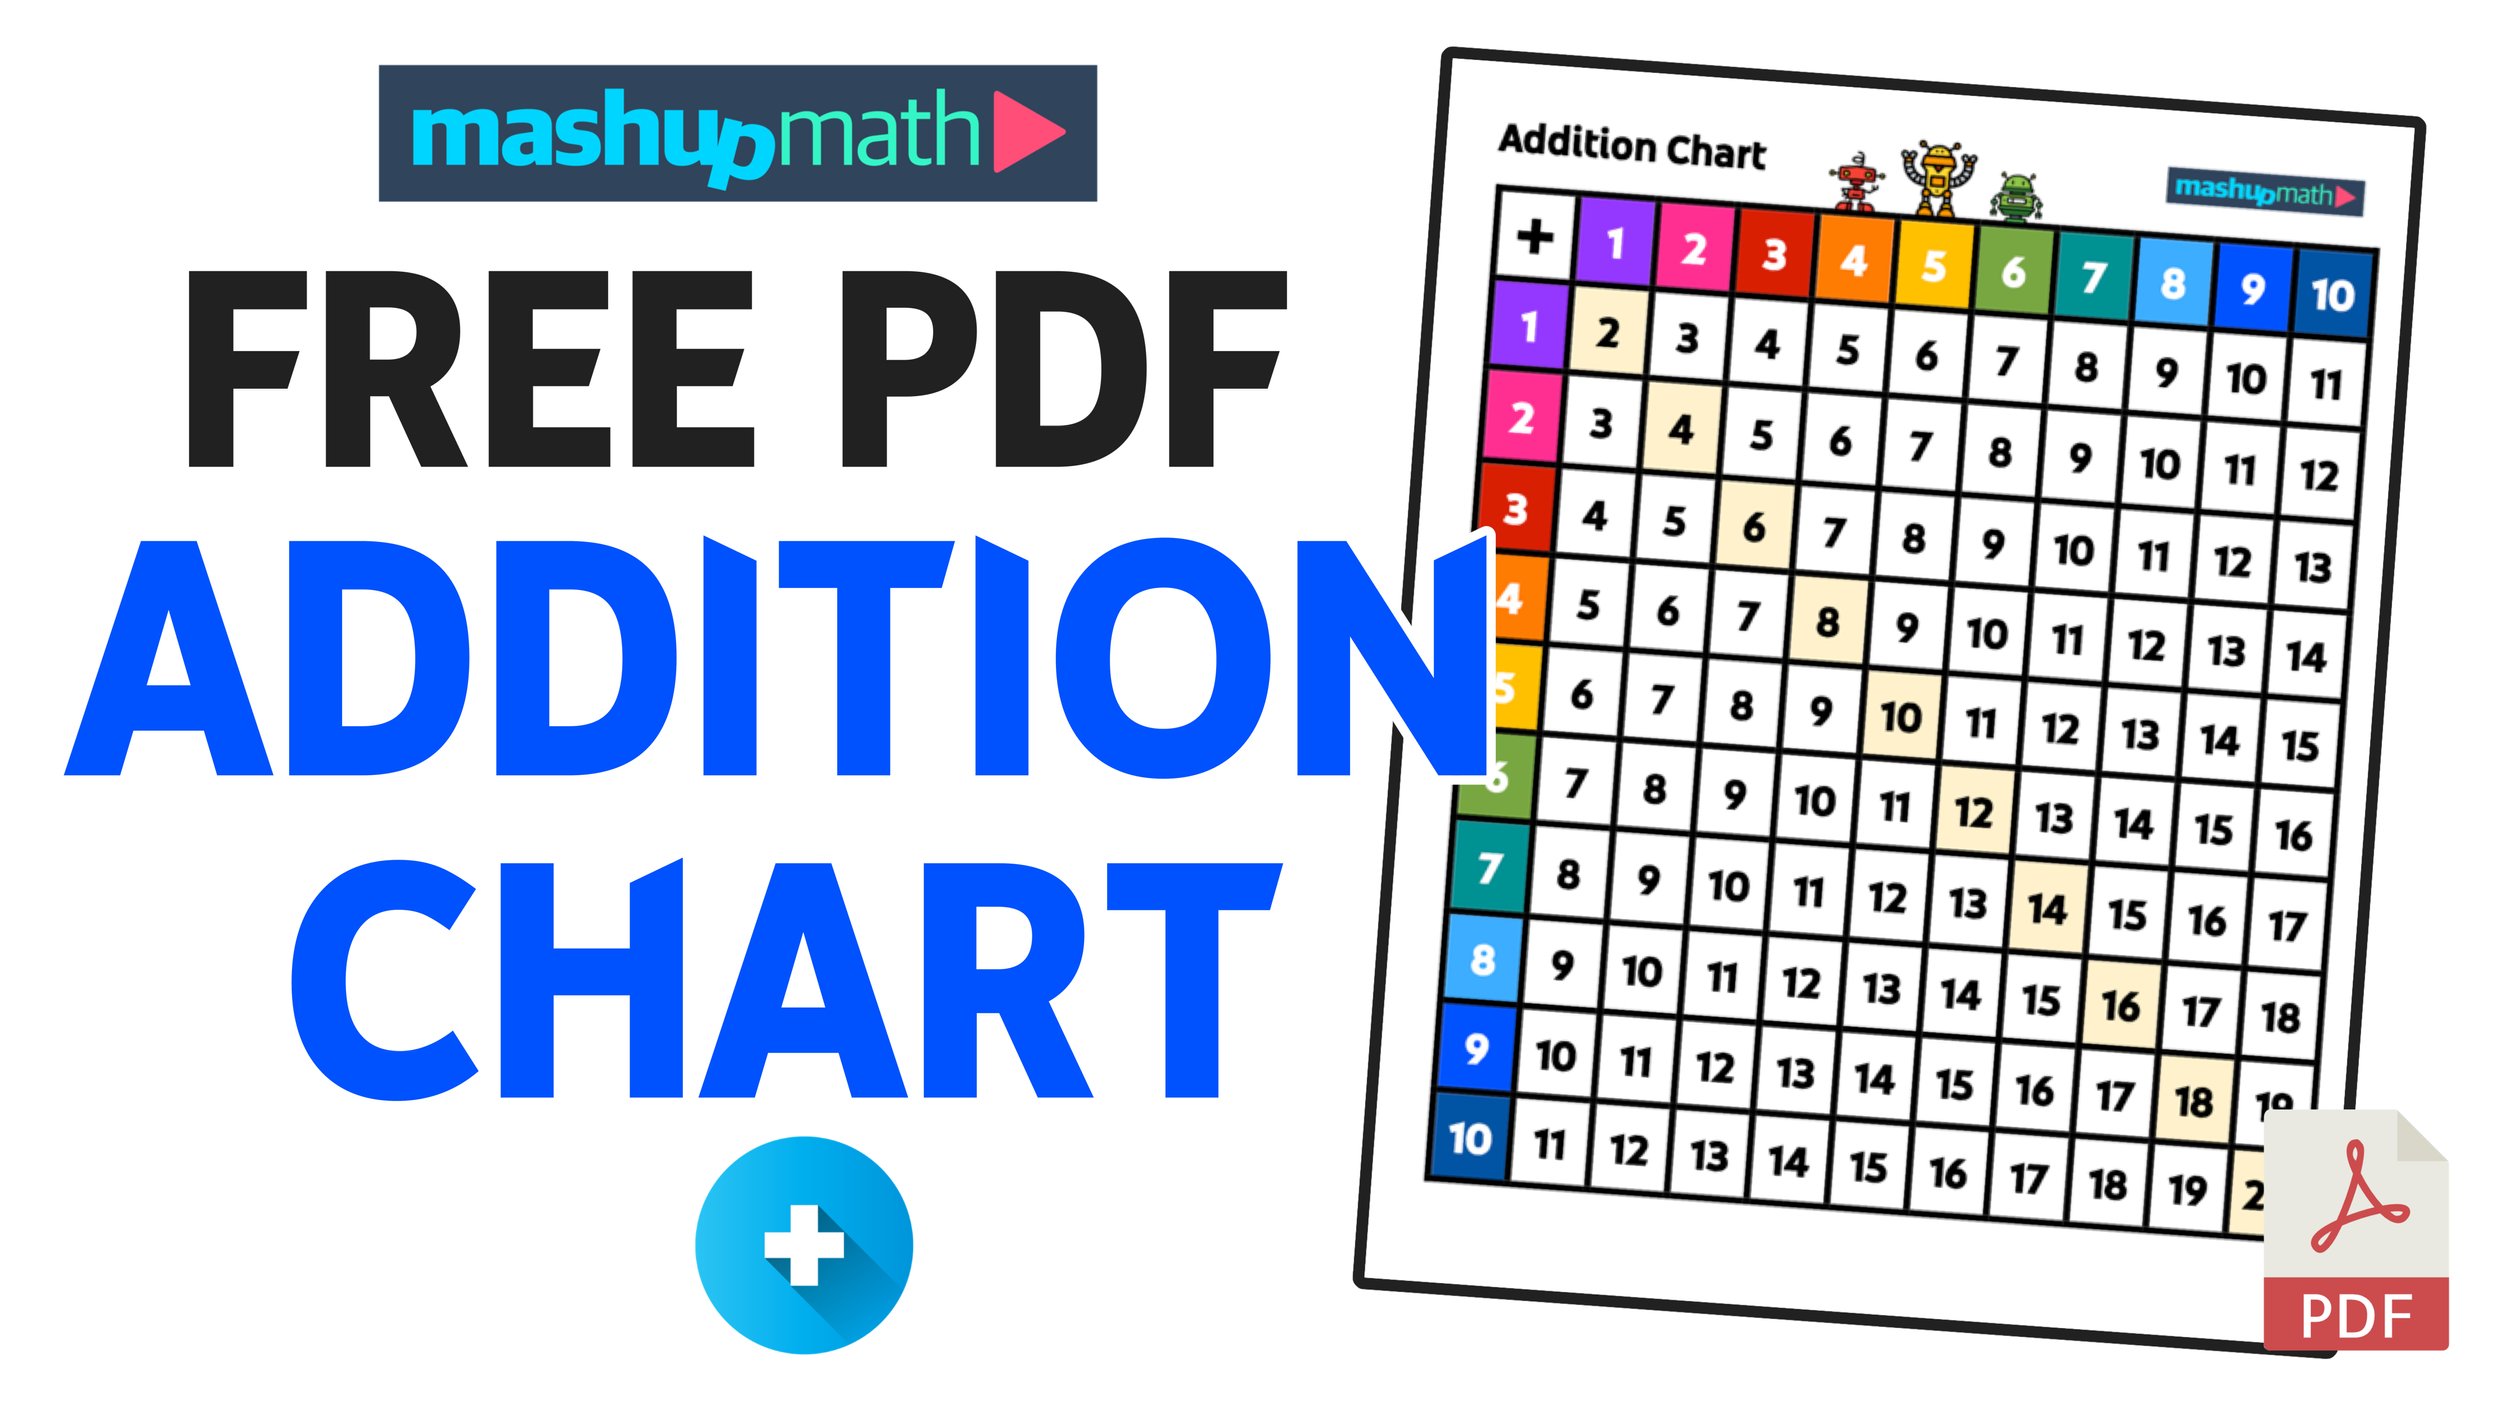
Download a Free Addition Chart (Printable PDF)
Free Addition Chart for Students
In math, being able to add numbers is a core foundational skill that every student must master in order to be able to perform many complex calculations later on.
Whether you are an elementary teacher helping your students to learn their addition facts or an adult looking to refresh previously learned math skills, an addition chart can be an extremely useful visual tool.
So, if you are looking for an easy visual reference for adding numbers up to 20, then you’re in the right place!
You can use the link below to download your free addition chart as an easy-to-print PDF file. And keep reading to learn more about addition charts and how they are used to practice and master your adding skills.
Addition Chart Preview
How to Use an Addition Chart
An addition chart, also known as an addition table chart or addition facts chart, is a visual aide that shows the math facts from 1 to 10 organized in a grid that works like a bing board where the value inside of each interior box represents the sum of the corresponding column and row.
For example, if you wanted to find the sum of 7 and 4, you would find 7 along the top row and 4 along the left column and then use your fingers or a pencil to find the corresponding interior box. Since the value inside of this box is 11, you could conclude that 7 + 4 = 11.
This process is demonstrated in Figure 01 below. Repeat this process with as many practice problems as needed.

Figure 01: How to Use an Addition Chart
Why You Should Use a Printable Addition Chart
An addition chart is most effective when it is printable and given to students to have a physical copy of and to use as a hands-on tool whenever they are working on addition problems.
Printable addition charts, like the one you can download above for free, are great because they can be used offline and in-person as often as you need them. Many parents and teachers opt to print our addition chart in color and either put it in a plastic binder sleeve or, even better, have it laminated for continual use day after day.
You can also print a copy that can be posted somewhere in your home or classroom to serve as a reference guide (such as on a refrigerator door or on a classroom bulletin board).

Addition Chart Printable Version
Moving On From Using an Addition Chart
Since the addition chart is only a temporary tool that will help students become more comfortable with practicing and learning their basic addition facts, you should be prepared to stop using the chart once you have mastered the addition facts up to ten.
Once you feel comfortable with your understanding of addition up to ten, you can continue progressing you math skills by moving onto working with larger numbers.

An addition chart is a great visual aide for helping students to master the basic addition facts before moving onto more complex math skills.
Photo by Natasha Hall on Unsplash
Read More Posts About Math Education: