
The Mathematics of Major League Baseball


Spring is finally here, which signals the closing weeks of the school year for students and teachers as well as the beginning of a new season of Major League Baseball.
Baseball, arguably more than any other sport, is driven by statistics. Even the casual fan understands the concepts of batting average, fielding percentage, and earned run average. The analysis of such data is used to evaluate a player’s performance and has a tremendous impact on rankings, contracts, and awards.
Math teachers can take advantage of their students’ enthusiasm for the new baseball season by teaching math concepts like averages, probability, and sample sizes in the context of baseball and the popular statistics that apply to both pitchers and hitters.
In fact, some MLB teams have put this idea into practice by establishing Math and Science in Baseball summer camp programs for local students.
Fortunately, you don't need access to sponsored programs to share the benefits of teaching math in the context of baseball. The following is a step-by-step guide through an activity, which can be done in the classroom or at home, that gives students the opportunity to calculate and analyze the most popular performance statistics of their favorite baseball players.
The following section will walk you through the Baseball Stats Analysis activity. You can download the free, corresponding PDF guide by CLICKING HERE.
Activity: The Mathematics of Baseball
For this activity, you will need to visit ESPN.com, where you will be able to access the statistical profile of the professional players (past or present) whom you choose to analyze. You will have to choose one hitter and one pitcher and you can access their profiles by using the search feature on ESPN's website.

To access a player's statistical profile, type his or her name into the search box on ESPN.com.
From a player’s profile page, click on the STATS tab to access his career performance data.
For this example, we will be using Bryce Harper of the Washington Nationals as our hitter and Noah Syndergaard of the New York Mets as our pitcher.

*Note that all statistics referenced in the post are current as of 4/21/2016. Any changes in data are a result of games played after the posting date.
Part One: Calculating Batting Statistics
Once you have your player’s performance data handy, you will be able to calculate the following performance statistics:
Batting Average (AVG): The likeliness that a player will get a hit in any given at-bat.
Slugging Percentage (SLG): Measures a hitter’s power by weighing hits based on the total number of bases. For example, a triple would be worth three times as much as a single.
Note that each of these statistics are reported to three decimal place. A player with an AVG of .300 is considered to have a batting average of three hundred.
Now you are ready to perform your calculations with the aid of the following formulas:

We'll begin with calculating Bryce Harper’s career batting average. To find this offensive stat, you will be focusing on his career statistics, which are compiled in the TOTAL row at the bottom of the statistics table on his player profile.

The TOTAL row at the bottom of the player profile shows compiled career statistics.
To find Bryce Harper’s career batting average, you will need to divide his 544 career hits by his 1879 career at-bats

And since batting average is reported to the third decimal place, you can confirm that he has a career AVG of .290.
This statistic tells us that Harper will collect, on average, 290 hits for every 1,000 at-bats, or 29 hits for every 100 at-bats, or 14.5 hits for every 50 at-bats, etc.

Isn't this fun? Let’s keep going. To find Harper’s slugging percentage (SLG), you will have to first calculate his total bases (TB). To find TB, you will need to know the total number of singles, doubles, triples, and home runs he has hit. From his profile, you can see that he has 102 doubles, 15 triples, and 104 home runs, for a sum of 221 extra-base hits.
To find the number of singles, simply subtract the number of extra-base hits (221) from his 544 total hits, to get 323.
Now you are ready to calculate the numerator of the formula. Notice that singles (1B) are only counted once, doubles (2B) are counted twice, triples (3B) are counted thrice, and home runs (HR) are counted four times!
323(1) + 102(2) + 15(3) + 104(4) = 988
Finally, divide the 988 total bases by 1879 career at-bats, for a slugging percentage of .526 !

By comparison, where does Bryce Harper's slugging percentage rank him amongst players like Dexter Fowler of the Chicago Cubs, Josh Donaldson of the Toronto Blue Jays, and David Ortiz of the Boston Red Sox?
Part Two: Calculating Pitching Statistics
Now you will reference your pitcher's profile page. Pitchers play a unique position and have their own performance statistics, two of which you will learn to calculate:
Earned Run Average (ERA): The mean number of earned runs scored against a pitcher per nine innings pitched. An ERA of 3.00 would mean that, on average, a pitcher allows three runs per nine innings pitched.
Walks Plus Hits Per Innings Pitched (WHIP): Reflects how difficult it is for a batter to reach base against a pitcher. The lower a pitcher's WHIP, the more difficult it is to reach base against him.
*Note that both of these statistics are reported to the second decimal place.
Now we are ready to perform our calculations with the help of the following formulas:

You will also need to reference your pitcher’s statistic profile. I have chosen to analyze the Noah Syndergaard of the New York Mets.
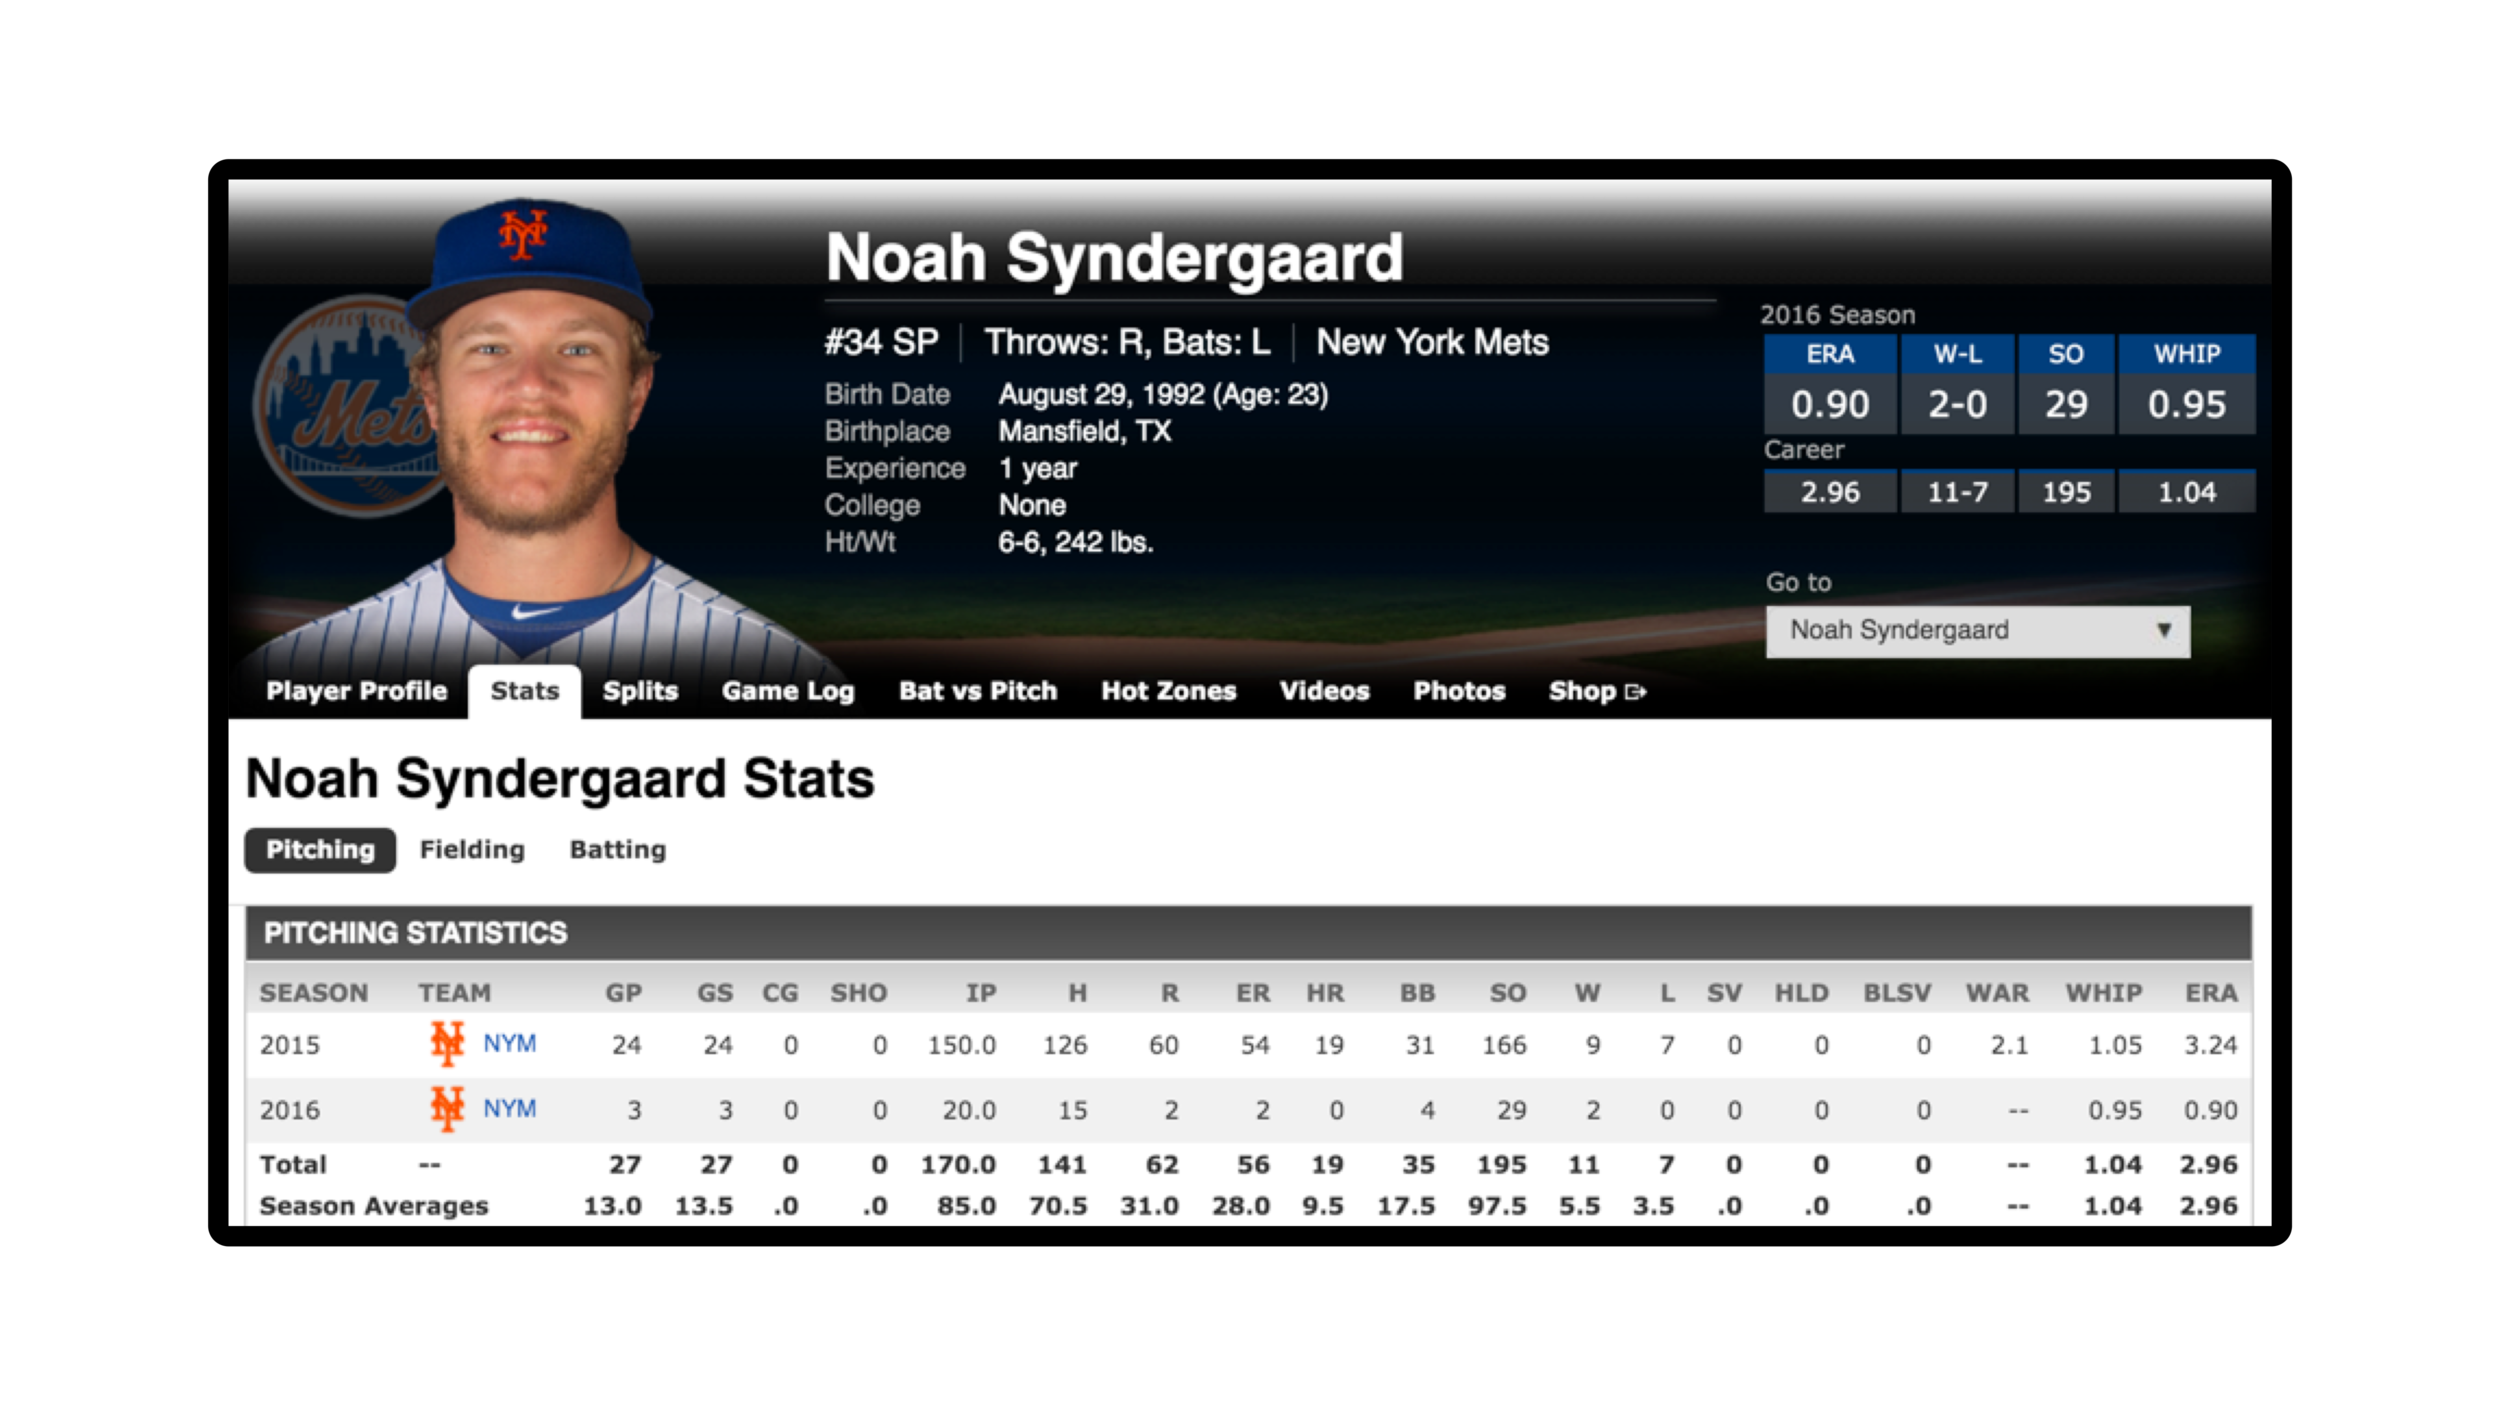
To find Syndergaard’s career ERA, you will need to divide his total career earned runs (ER) by innings pitched (IP) and then multiply that quotient by 9:

So you can conclude that he has a career ERA of 2.96.

By comparison, where does Noah Syndergaard's 2.96 ERA rank him amongst pitchers like Felix Hernandez of the Seattle Mariners, Clayton Kershaw of the Los Angeles Dodgers, and Dellin Betances of the New York Yankees?
Finally, we can calculate Syndergaard’s WHIP by first adding his total walks (BB) and hits allowed (H) and then dividing the sum by his total innings pitched (IP):

You can conclude that Syndergaard has a WHIP of approximately 1.04, which means that, on average, he allows about one batter to reach base per inning.

Conclusion
Learning math in the context of sports statistics is an awesome way to engage students and to expose them real-world applications.
Be sure to download the free lesson guide that accompanies this activity and let me know which players you chose in the comments below!
