How to Calculate Percent Error in 3 Easy Steps

How to Calculate Percent Error in 3 Easy Steps

How to Calculate Percent Error Using the Percent Error Formula

Step-by-Step Guide: How to Calculate Percent Error in 3 Easy Steps


Free Step-by-Step Guide: How to Calculate Percent Error


Whether you are a student working on solving math problems or an analyst working in a science lab, knowing how to calculate percent error is an important and useful skill both inside and outside of the classroom. Percent error tells us how close a measured or estimated value is compared to the actual value. In short, percent error is a tool for measuring accuracy. The smallest that a percent error is, the more accurate the measurement is (and vice versa), and calculating percent error is a relatively easy task provided that you can following a few simple steps.

In this free guide, you will learn How to Calculate Percent Error in 3 Easy Steps and how the percent error formula can be applied to real-life scenarios and contexts. Together, we will work through three step-by-step examples that range from basic to intermediate to advanced, to help you become a pro at calculating percent error.

You can work through the sections in this guide in order, or you can click on any of the text links below to jump to any section of this page.


Preview: Percent Error Example #1


Quick Review: What is Percent Error?

Let’s start off with a quick review of percent error and the percent error formula.

Often used in math and science, Percent Error is a formula that can be used to calculate the difference between a measured or estimated value compared to actual or exact value, and it is expressed as a percentage.

Whenever you are faced with questions related to measurement such as:

  • I made a guess about something measurable. How far off was my guess compared to the actual value?

  • I made a measurement. How accurate was my measurement?

  • I estimated the value of something. How close was my estimation compared to the actual value?

Being able to answer these questions comes in handy in science in math whenever you are comparing estimations or predictions to actual results.

The Percent Error Formula

Percent Error can be calculated by using the following formula:

  • Percent Error = [( |Measured Value - Actual Value|) / Actual Value] x 100

Where…

  • The Measured Value is a number that represents a measurement, estimation, or calculation that you or somebody else has made.

  • The Actual Value represents the actual or exact value.

As long as you know that Measured Value and the Actual Value, you can plug those numbers into the Percent Error Formula and solve.


Figure 01: The Percent Error Formula


How to Calculate Percent Error in 3 Easy Steps:

Now we are ready to learn how to calculate percent error using the percent error formula and by following these three simple steps:

  • Step 1: Plug the Measured Value and the Actual Value into the Percent Error Formula.

  • Step 2: Find the absolute value of the difference of the Measured Value and the Actual Value, and then divide that result by the Actual Value.

  • Step 3: Multiply your result from Step 2 by 100 and express your answer as a percent.

For example, considered the following scenario:

How to Calculate Percent Error Example #1

Problem: Christian attempted to measure his own height and came up with an estimated height of 58 inches. After a visit to the doctor, it was determined that his actual height is 60 inches. What was the percent error of Christian’s measurement?

For this example, we know that:

  • Measured Value: 58 inches

  • Actual Value: 60 inches

With this information, we can use the Percent Error Formula and our 3-step process to solve the problem as follows:

Step 1: Plug the Measured Value and the Actual Value into the Percent Error Formula.

Using the Percent Error Formula:

  • Percent Error = [( |Measured Value - Actual Value|) / Actual Value] x 100

We can substitute as follows:

  • Percent Error = [( |58 - 60|) / 60] x 100

Step 2: Find the absolute value of the difference of the Measured Value and the Actual Value, and then divide that result by the Actual Value.

We can evaluate the first part of the equation as follows:

  • ( |58 - 60|) / 60 = |-2|/60 = 2/60 = 0.33333333….

Step 3: Multiply your result from Step 2 by 100 and express your answer as a percent.

Finally, we can take our result from the previous step and multiply if by 100 as follows:

  • 0.33333333…. x 100 = 3.333333… ≈ 3.33%

Final Answer: The Percent Error is 3.33%

The graphic in Figure 02 below illustrates how we solved this problem of how to calculate percent error. Now let’s move onto another example.


Figure 02: How to Calculate Percent Error in 3 Steps.


How to Calculate Percent Error Example #2

Problem: Troy estimates that his hometown has a population of 9,000 people, but the census data showed that the actual population is 10,750 people. What is the percent error?

We can solve this percent error problem using the Percent Error Formula and by following the same steps as we did in the previous example.

  • Percent Error = [( |Measured Value - Actual Value|) / Actual Value] x 100

Step 1: Let’s start by inputting both the Measured Value and the Actual Value and plugging them into the Place Value Formula. Remember that the measured value can refer to a measurement, an estimation, or even a guess.

  • Measured Value: 9,000

  • Actual Value: 10,750

  • Percent Error = [( | 9,000 - 10,750|) / 10,750 ] x 100

Step 2: Now we can evaluate the first part of the equation as follows:

  • | 9,000 - 10,750|) / 10,750 = | -1,750|/10,750 = 1,750/10,750 = 0.16279…

Step 3: Finally, we can multiply the result from the previous step by 100 and express our answer as a percentage.

  • 0.16279 x 100 = 16.279 ≈ 16.3%

Final Answer: The percent error was 16.3%

Figure 03 below shows the step-by-step process for solving Example #2.


Figure 03: How to Calculate Percent Error


How to Calculate Percent Error Example #3

Are you starting to get the hang of how to use the percent error formula to figure out percent error? As long as you know how to use the formula correctly, you can solve any problem that requires you to calculate percent error. So, let’s go ahead and work through one more practice problem.

Problem: A chemistry student calculated to density of a substance as 1.19 g/cm³. The actual density of the substance is 1.04 g/cm³. What is the percent error.

Step 1: Just like the previous examples, we can start by plugging in our given values:

  • Measured Value: 1.19

  • Actual Value: 1.04

  • Percent Error = [( | 1.19 - 1.04|) / 1.04 ] x 100

Step 2: Next, we can evaluate the first part of the equation as follows:

  • (|1.19 - 1.04|) / 1.19 =|0.15| / / 1.04 = 0.15/1.04 = 0,14423

Step 3: Now we just have to multiply 0.14423 by 100 to get our final answer:

  • 0.14423 x 100 ≈ 14.4%

Final Answer: The percent error is 14.4%

You can see the entire 3-step process for solving Example #3 in Figure 04 below.


Figure 04: How to Calculate Percent Error Example #3 Solved


How to Calculate Percent Error Practice Problems

Are you ready to try a few practice problems on your own? If so, go ahead and try the following problems on your own and click here when you are ready to see the answer key.

Directions: Calculate percent error for each of the following and round your answer to the nearest tenth decimal place.

1.) Measured Value: 48, Actual Value: 50

2.) Measured Value: 4.2 Actual Value: 5.0

3.) Measured Value: 105 Actual Value: 110

4.) Measured Value: 8.5 Actual Value: 9.0

5.) Measured Value: 309 Actual Value: 285

6.) Measured Value: 0.87 Actual Value: 0.91

7.) Measured Value: 0.976 Actual Value: 1.002


Percent Error Practice Problems Key:

  1. 4%

  2. 16%

3. 4.6%

4. 5.6%

5. 8.4%

6. 4.4%

7. 2.6%


More Free Math Resources:

Free Division Chart —Printable PDF

Comment

Free Division Chart —Printable PDF

Free Printable Division Chart for Kids

Division Chart for Students

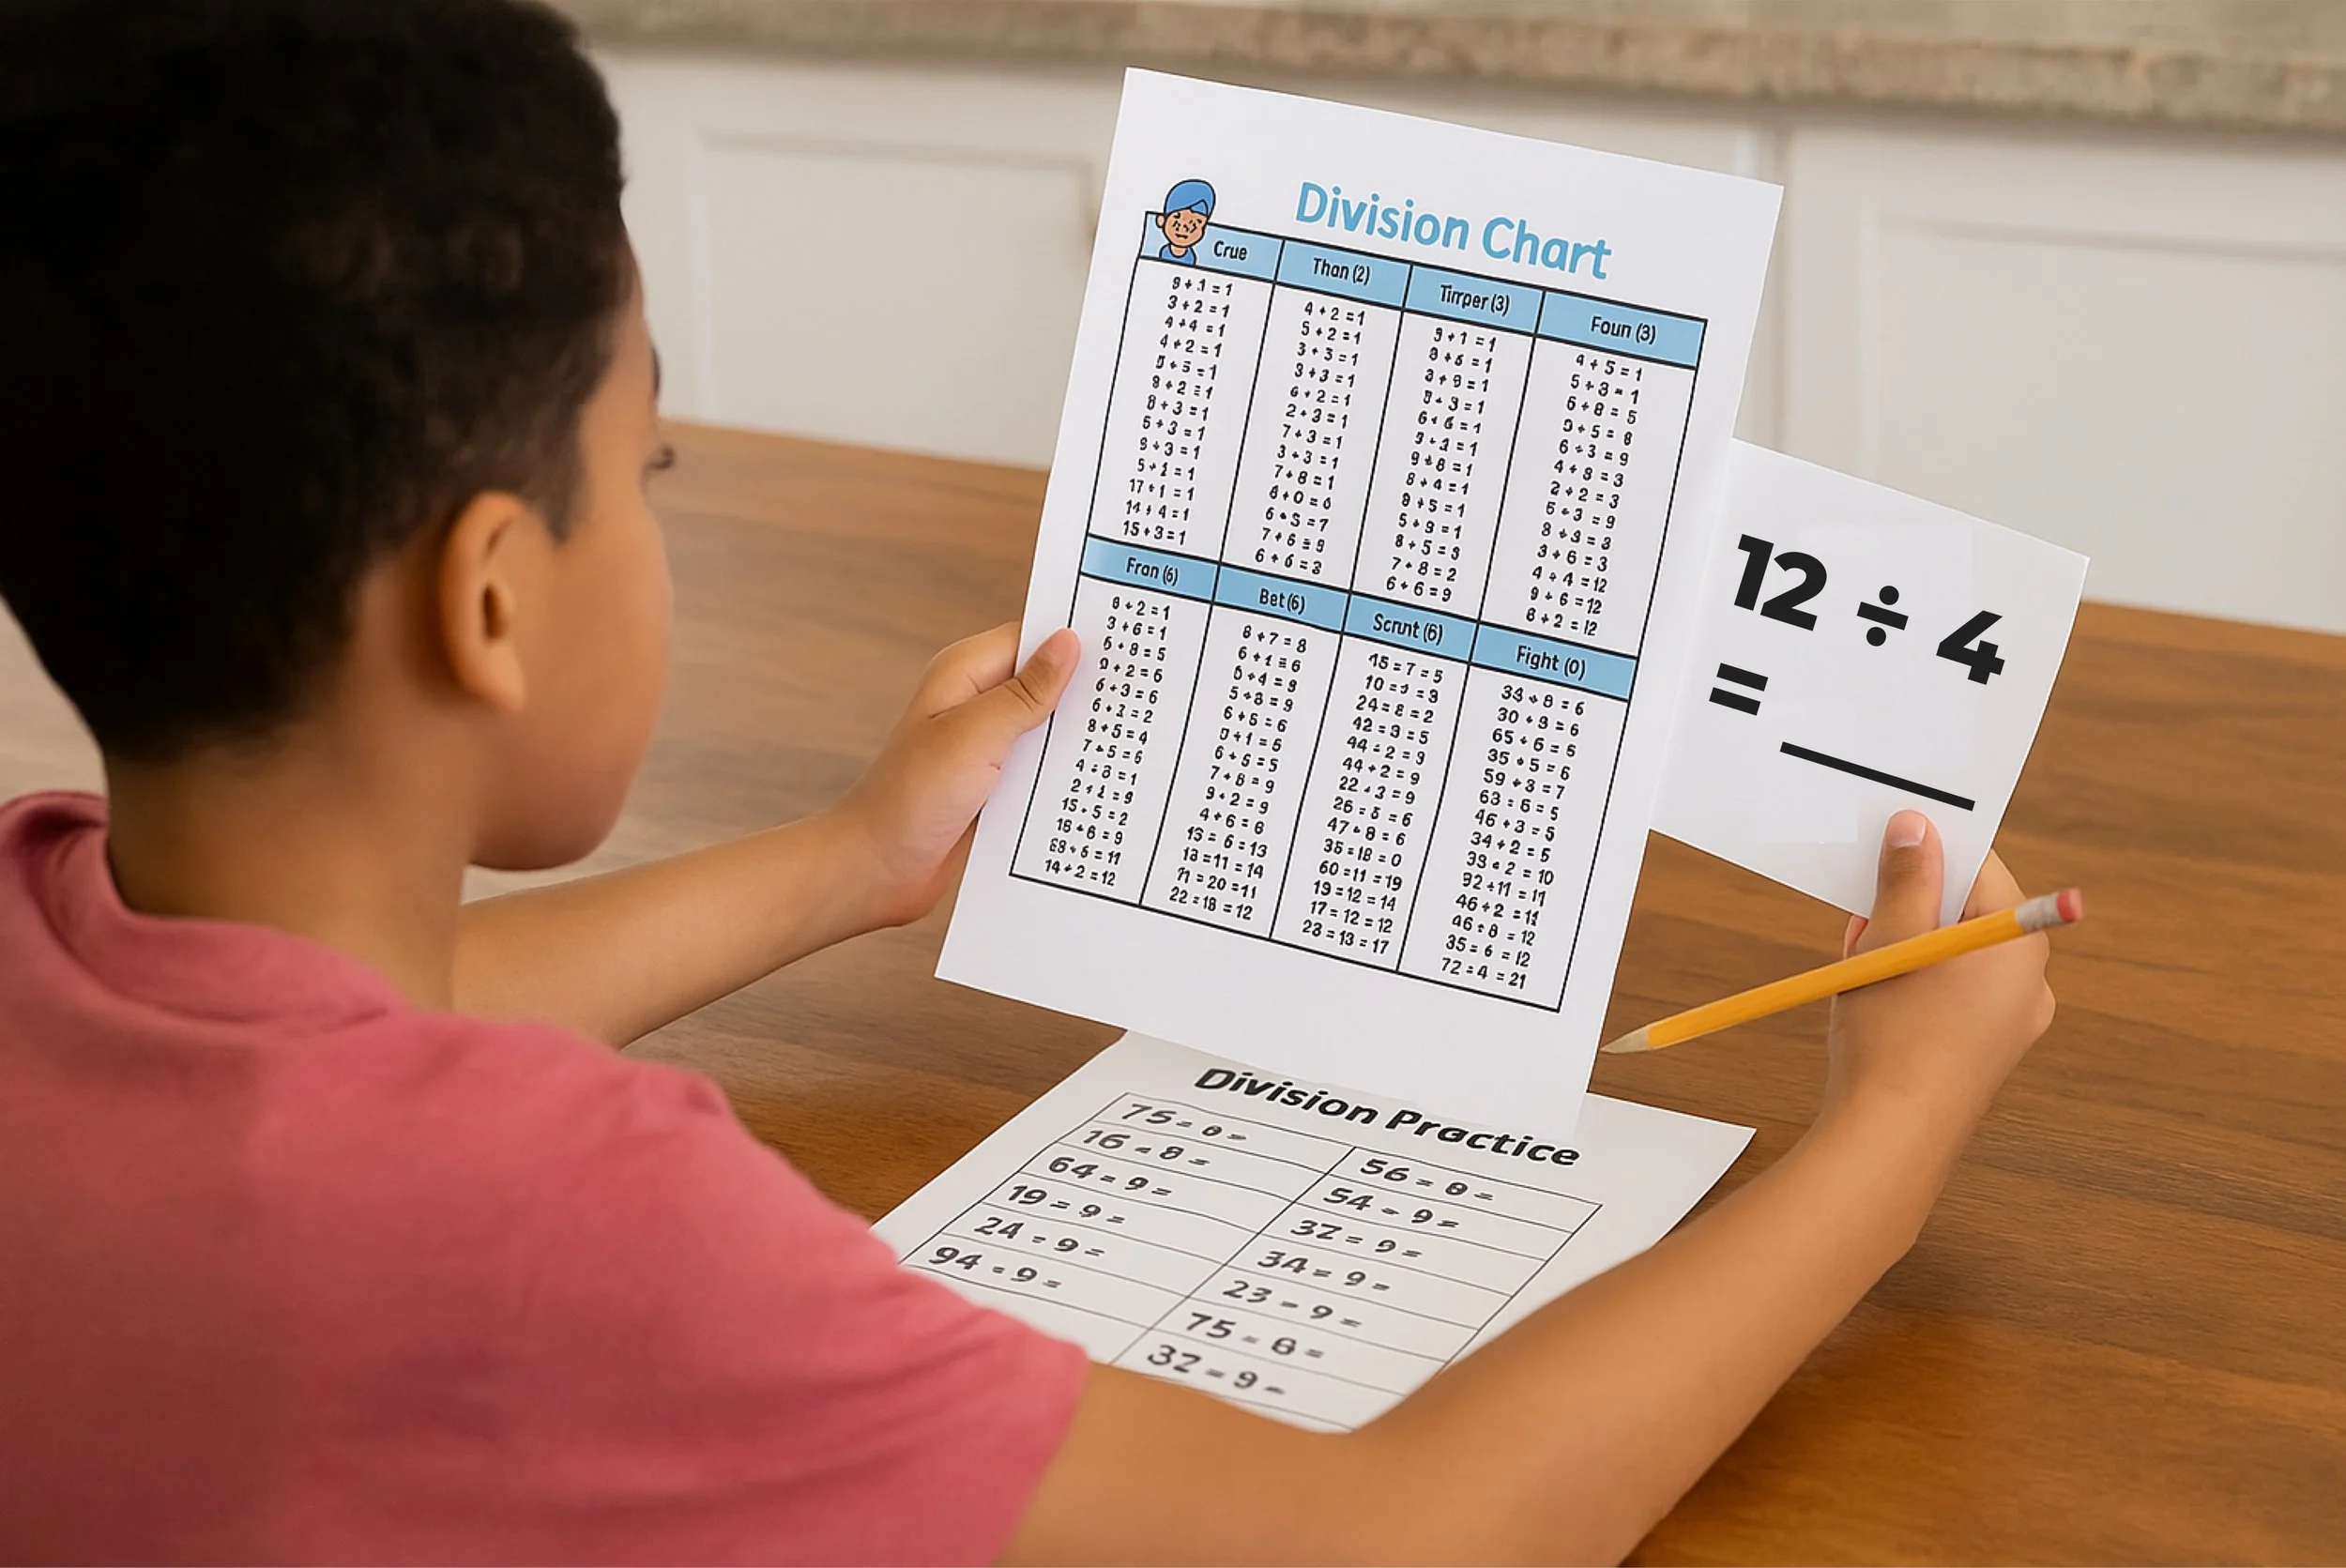
If your kids are learning how to divide, then a division chart is an effective and useful visual tool for helping them to learn division facts and understand patterns and relationships related to division.

While using a multiplication chart to learn multiplication facts and times tables is a common practice at the elementary level, using a division chart to learn division facts is less common. However, division charts can be extremely effective when it comes to helping kids to learn how to divide and to study and remember relationships related to division.

If you are looking for a printable reference that includes division facts for the numbers 1-12, our handy free division chart is an awesome tool that can help students in a variety of ways. Having a decimal chart nearby when learning how to divide numbers and how to solve elementary division problems is a great way to support students and help them to learn their division facts.

Below you will find a link to download your free Fraction Chart as a printable PDF file. The entire division chart fits on one page, and it can be printed in color or in black-and-white.


Division Chart (Preview)


Division Chart Download

Click Here to Download Your Free Division Chart PDF

(When you click on the text link above, the PDF preview window will appear, where you will have the option download and/or print your division chart).

Now that you have your Division Chart on hand, here are a few great ideas for how you can use division charts to support your students in your classroom or your kids at home.

How to Use a Division Chart to Help Your Students

When it comes to helping young learners with complex topics like multiplication and division, visual tools can be an incredibly effective resource for helping students to develop both procedural fluency as well as conceptual understanding.

In the case of learning how to divide whole numbers, using a division chart is a great way to help students learn important division facts and how to perform basic division. Additionally, once students have become familiar with multiplication and multiplication charts, they can use a division chart to better understand the inverse relationship between multiplication and division.

If you are looking for a few specific ways to use a division chart to help your students with this important math skill, here are a few ideas:

Learning Important Math Facts

Similar to how multiplication tables help students to understand and remember common multiplication facts, a division chart can help students to understand and remember common division facts. For example, students who memorize that 8 x 3 = 24 and also that 24 ÷ 8 = 3 are better able to make quick and accurate computations and solve problems. They are also better able to understand the relationship between multiplication and division.


A division chart is a great too for supporting students during independent practice. (Image: Mashup Math G)


Support Kids at Home and in the Classroom

One of the best ways to use a Division Chart to help your kids at home is to print it out and have it laminated so that you can use it as a reference guide as often as you need to. When students are first learning how to divide and doing independent practice at home, having a physical division chart nearby can support students whenever they are struggling with solving a problem. This strategy also works for students in the classroom, as teachers can either post a division chart in their classroom, or give each student their own division chart to use as a reference. In either scenario, students who have a hard time with remembering division facts can use a division chart to support their learning, build confidence, and prevent them from becoming overly frustrated when they are struggling.

Check Your Work

As your students become more comfortable and confident in their division skills, they will not need to have a division chart as reference as often. When your students reach this level, you can have them work on work on solving division problems on their own, and then they can self-assess by checking their answers using a division chart once they have completed an assignment. This strategy helps students to identify their strengths and weaknesses, and what particular division facts they need to practice more and study further.

Recognizing Patterns and Relationships

Once your students are able to divide whole numbers consistently, you can start to give them assignments that mix multiplication problems and division problems together. At this level, having students look at multiplication charts and division charts side-by-side is a great way to help students to deeply understand the relationship between multiplication and division, which will help them to solve more complex and multi-step problems in the future. For example, consider having students work on these two problems one after the next:

  • 21 ÷ 7 = 3

  • 7 x 3 = 21

After students solve both problems, students are better able to understand why multiplication and division are inverse operations of each other.

By helping your students develop a strong foundational understanding of division, how to divide numbers, and the inverse relationship between division and multiplication, you are putting your students on a path to be successful at higher levels of math, which will benefit them in the classroom and beyond.

Keep Learning:

Comment

How to Find Y Intercept with 2 Points

How to Find Y Intercept with 2 Points

How to Find Y Intercept with 2 Points

Step-by-Step Guide: How to Find y intercept with 2 points given to you


Free Step-by-Step Guide: How to find y-intercept of a graph given two points.


Understanding how to find the y-intercept of a line given 2 points (i.e. (x,y) coordinates) that the line passes through is an incredibly important and useful algebra skill that every student can easily learn with a little practice. In fact, knowing how to find the y intercept with 2 points given is a foundational skill that will help you to develop a stronger overall understanding of linear equations on the coordinate plane.

If you are an algebra student who is struggling with this key skill or an algebra teacher looking for a simple way to explain this topic in your classroom, this free step-by-step guide to finding y intercept with 2 points given shares everything you will ever need.

In the sections ahead, we will walk through all of the steps to finding the y intercept of a line with 2 points, including a recap of some key vocabulary as well as exactly how to solve any problem that gives you 2 coordinate points and asks you to find the y-intercept of a line. After working through different practice problems, you will have gained significant practice and experience with this key algebra skill.

While we recommend that you work through each section of this guide in order (the review section covers several important foundational skills and vocabulary terms related to linear functions), you can jump to any section by using the quick-links below. Ready to get started?

How to Find Y Intercept with 2 Points: Sections:


Figure 01: What is the Y-Intercept?


Quick Review: Lines and Y-Intercepts

Before we learn how to find y intercept with 2 points, let’s do a quick review of some key algebra terms and concepts related to linear functions.

For starters, it’s important to remember that linear equations can be expressed in slope-intercept form, also known as y = mx + b form, where:

  • slope-intercept form: y = mx + b

  • m is the slope

  • b is the y-intercept

For example, a line with the equation y = ⅓x + 4 has a slope of ⅓ and a y-intercept at 4.

What exactly is a y-intercept?

The y-intercept of a line is the coordinate point where the line crosses the y-axis. The y-intercept is always written as an (x,y) coordinate where x is 0.

So, the line y = ⅓x + 4 has a y-intercept at (0,4).

The image in Figure 01 above shows three different linear functions and their y-intercepts. Do you notice a pattern?

Knowing the coordinates of the y-intercept of a line is helpful because it tells you the starting point for graphing the line, and it also helps you to write the equation of the line in slope-intercept form, y=mx+b, where m is the slope of the line and b is the y-intercept.


Figure 02: Review: Slope-Intercept Form (y=mx+b)


So, whenever you are given two coordinate points that a line passes through, you have to figure out the values of m and b in order to determine the coordinates of the y-intercepts.

With these concepts in mind, let’s go ahead and try our first example problem of how to find y intercepts with 2 points.

Make sure that you know all of the perfect squares from 1 to 144 (as shown in Figure 01 above) before moving onto the next section.

While it is relatively easy to simplify a square root of a perfect square, it is more complicated to simplify a square root of a non-perfect square, which is what we will be focusing on in the next section, where, for example, we will look at finding the perfect squares of numbers like 18, 75, and 112.


How to Find Y Intercept with 2 Points

Now we are ready to try our first example where we will learn how to find y-intercept with 2 points given, and will solve them by following these 3 simple steps:

To find the y-intercept using two points, follow these steps:

Step 1: Use the Given Coordinates to Find the Slope of the Line

Step 2: Plug One point and Slope, m, into the Slope-Intercept Form Formula (y=mx+b)

Step 3: Solve for b and determine the y-intercept

Example A: Find the y intercept of the line passing through (2,5) and (4,9)


Example A: Find the y intercept of the line passing through (2,5) and (4,9).

For our first example, we are given two points and we are tasked with finding the y-intercept of the line that passes through them. We can use our 3-step strategy to solve this problem as follows:

Step 1: Use the Given Coordinates to Find the Slope of the Line

For this example, we are given the following coordinate points:

  • (2,5) and (4,9)

We can use the slope formula to calculate the slope of the line that passes through these points as follows:

  • m = (y₂ - y₁) / (x₂ - x₁)

  • m = (9-5) / (4-2) = 4/2 = 2

  • m=2

So, the line has a slope of 2.

Step 2: Plug One point and Slope, m, into the Slope-Intercept Form Formula (y=mx+b)

Now that we know that m=2, we can start to build the equation of this line in y=mx+b form as follows:

  • y = 2x + b

For the second step, we have to select one of the two (x,y) coordinates that was given to us, plug it into the slope-intercept form equation, and solve for b as follows:

  • Let’s choose the point (2,5), where x=2 and y=5

  • y = 2x + b

  • 5 = 2 (2) + b

  • 5 = 4 + b

  • 1 = b → b = 1

We have now solved for b, and we can conclude that b=1.

Step 3: Solve for b and determine the y-intercept

Now that we know that b=1, we can write the y intercept as a coordinate point and finish the problem.

Remember that the y-intercept of a line is always written as an (x,y) coordinate where x is 0.

Final Answer: The line has an equation of y=2x + 1 and the y-intercept is at (0,1)

Figure 02 shows the step-by-step process for solving this first problem, and Figure 03 shows the graph of y=2x+1 (notice how the line passes through the two given points (2,5) and (4,9) as well as the y-intercept at (0,1).

Figure 02: How to Find Y Intercept with 2 Points (Step-by-Step)

Figure 03: The graph of y=2x+1

Now that we have solved our first how to find y intercept with 2 points problem, let’s apply what we have learned to another example.


Example B: Find y intercept with 2 points given: (-1,4) and (3,0)


Example B: Find the y intercept of the line passing through (-1,4) and (3,0).

Let’s go ahead and solve this next problem using the same steps as the previous example.

Step 1: Use the Given Coordinates to Find the Slope of the Line

For Example B, we know that the line passes through the points:

  • (-1,4) and (3,0)

Let’s plug these points into the slope formula to figure out the slope (m) of the line as follows:

  • m = (y₂ - y₁) / (x₂ - x₁)

  • m = (0-4) / (3-(-1)) = 4/4 = -1

  • m=-1

This line has a slope of —1.

Step 2: Plug One point and Slope, m, into the Slope-Intercept Form Formula (y=mx+b)

Now we can write the equation of the line in slope-intercept form where m=-1 as follows:

  • y = -1x + b

  • y= -x + b

Now, let’s take one of the two given points and plug it into the slope-intercept form equation to solve for b as follows:

  • Let’s choose the point (3,0), where x=3 and y=0

  • y = -x + b

  • 0 = -(3) + b

  • 0 = -3 + b

  • 3 = b → b = 3

Therefore, we know that the y-intercept (b) is equal to 3.

Step 3: Solve for b and determine the y-intercept

Finally, we can take our result from Step 2 (b=3) and use it to write the y-intercept in coordinate form.

Final Answer: The line has an equation of y=-x + 3 and the y-intercept is at (0,3)

The entire process for solving this problem is shown in Figure 04 below, and the corresponding graph is shown in Figure 05.

Figure 04: How to find y-intercept with 2 points

Figure 05: The graph of y=-x+3.


More Free Math Resources:

Free Fraction to Decimal Chart (Printable PDF)

Comment

Free Fraction to Decimal Chart (Printable PDF)

Image: Mashup Math

Free Fraction to Decimal Chart

Are you in need of a quick reference chart for converting between fractions and decimals? Whether you are a student learning how to convert between fractions and decimals, or someone who could use a handy reference for everyday use, the free fraction to decimal chart shared on this page is the perfect tool for you.

Having a fraction to decimal conversion chart is incredibly useful for making fast and one hundred percent accurate conversions between decimals and fractions. Our free fraction to decimal chart includes 64 common fractions and their decimal equivalents. In terms of measurement, our fractions to decimals chart includes conversions for all common fractional measurement units starting at 1/64.

In the next section, you will find a link to download your free Fraction to Decimal Chart as a PDF file. Some great ways to use our free fractions to decimals chart include:

  • Saving the PDF file on your phone to reference conversions wherever you go.

  • Print the chart and have it laminated for repeated use (you can keep it in your notebook, tool box, etc.)

  • Email the PDF chart to yourself and keep it in your inbox as an accessible conversion guide.

Do you want to learn how to convert between fractions and decimals without a chart? Check out our free step-by-step lesson on converting between decimals and fractions in 3 easy steps!


Free Fractions to Decimals Chart (Preview)


Fraction to Decimal Chart Download

Click Here to Download Your free Fraction to Decimal Conversion Chart PDF

When you click the link above, a PDF window will open where you can download and/or print our free decimals to fractions chart.

Decimal to Fraction Chart: Real-World Uses

Now that you have downloaded your free Fraction to Decimal Conversion Chart, here are few ideas for some awesome real-world applications of this super hand tool:

Cooking and Baking: Many recipes include fractional portions (e.g. ⅓ cup of water, ½ pound of sugar, etc.) as suggested portion sizes, while many kitchen tools (such as digital scales) use decimal measurements. To ensure that you are following any given recipe correctly and accurately, it is important to be familiar with fraction and decimal conversions. For example, knowing that ⅓ is roughly approximate to 0.333 will allow you follow recipes and use tools that incorporate fractions or decimals.

Money: Another useful application of our fraction to decimal chart is working with money. For example, if you know that the fraction ¼ is equal to the decimal 0.25, then you can easily determine and understand things like sales prices, discounts, taxes, and overall budgeting. If you want to improve your ability to work with money and make sound financial decisions, then being able to convert between fractions and decimals is a great foundational skill that will serve you for a lifetime.

Sports: Numerical statistics are a huge part of sports, and being able to accurately convert between fractions and decimals allows you to better make sense of sports-related data. For example, if a basketball team has won 6 out of 8 games (6/8 simplifies to 3/4), we can conclude that the team has a 75% winning percentage (because 3/4 equals 0.75).
 

Having a fractions to decimals chart is a handy tool for construction professionals. (Photo by Josh Olalde on Unsplash)


Fractions to Decimals Chart for Construction and Home Improvement Projects

Construction and Home Improvement: Any time that you have to measure the length of something, it is super important for you to be able to easily convert between fractions and decimals. In fact, most rulers are divided by segments that each represent 1/64 of an inch, and construction professionals have to be familiar with dozens of fraction to decimal conversions (which is why many of them purposely keep a fraction to decimal chart in their toolbox for quick reference.

For example, builders must know that ⅝ of an inch is the same as 0.625 inches in order to make correct measurements, create accurate scale drawings, and to ensure that their plans are build according to the design. This is why, in construction, there is a common saying: measure twice and cut once. This is because it is imperative to get your measurements correct before you make a cut (e.g. a peice of wood or metal). Why? Because, once you cut something to size, there are no do-overs. So, you absolutely have to get your measurements right before making cuts.

So, having a fractions to decimals chart on hand is a great tool that will serve you in a variety of situations inside and outside of the classroom. By having a quick and reliable reference guide at your disposal, you can spend more focus and energy on whatever project you are working on (baking, buying, building, etc.), and less time on making mathematical calculations and conversions between fractions and decimals.

Read More Posts About Math Education:

Comment

How to Simplify a Square Root in 3 Easy Steps

How to Simplify a Square Root in 3 Easy Steps

How to Simplify a Square Root

Step-by-Step Guide: How to Simplify a Square Root in 3 Steps


Free Step-by-Step Guide: Ready to learn how to simplify a square root?


Simplifying square roots is a useful and important math skill that every student can learn with enough practice. By learning a simple 3-step process for simplifying square roots, you can learn to quickly and correctly simplify any square root (whether it is a perfect square or not), and that is exactly what we will be doing in this free guide.

The sections below will teach you exactly how to simplify a square root using a simple step-by-step method. Together, we will recap some key concepts and vocabulary terms and then work through three examples of how to simplify a square root. Whether you are learning this skill for the very first time or you are an experienced student in need of a quick and comprehensive review, this page will share everything you need to know about how to simplify a square root.

This guide is organized based on the following sections:

You can use the text links above to jump to any section of this guide, or you can work through the sections in order. Let’s get started!


Preview: How to Simplify a Square Root in 3 Steps.


Quick Intro: Square Roots and Perfect Squares

Before we work through examples of how to simplify a square root, let’s quickly recap some important concepts and vocabulary terms related to this topic.

In math, square roots are the inverse (or opposite) operation of squaring a number (i.e. multiplying a number by itself). And, conversely, the square root of a number is the value that, when multiplied by itself, results in the number that you started with.

For example, consider the square root of 16, which can be expressed using square root notation:

  • √16

We can say that √16 equals 4 because 4 times itself (i.e. 4x4 or 4²) equals 16, therefore:

  • √16 = 4 → because 4² = 16

Numbers like 16 are called perfect squares because their square roots are whole numbers, which makes them very easy to simplify.

In fact, you are likely already familiar with how to simplify many perfect squares such as:

  • √4 = 2 → because 2² = 4

  • √9 = 3 → because 3² = 9

  • √16 = 4 → because 4² = 16

  • √25 = 5 → because 5² = 25

  • √36 = 6 → because 6² = 36

  • √49 = 7 → because 7² = 49

  • √64 = 8 → because 8² = 64

  • √81 = 9 → because 9² = 81

  • √100 = 10 → because 10² = 100

Figure 01: Perfect Squares up to 144

Make sure that you know all of the perfect squares from 1 to 144 (as shown in Figure 01 above) before moving onto the next section.

While it is relatively easy to simplify a square root of a perfect square, it is more complicated to simplify a square root of a non-perfect square, which is what we will be focusing on in the next section, where, for example, we will look at finding the perfect squares of numbers like 18, 75, and 112.


How to Simplify a Square Root Examples

Now we are ready to use the following simple 3-step method for simplifying square roots to solve three practice problems:

Steps: How to Simplify a Square Root

  • Step 1: Identify two factors where one of them is a perfect square (choose the largest perfect square factor), and rewrite as a product.

  • Step 2: Split the product using two square root symbols.

  • Step 3: Simplify the perfect square and rewrite your final answer.

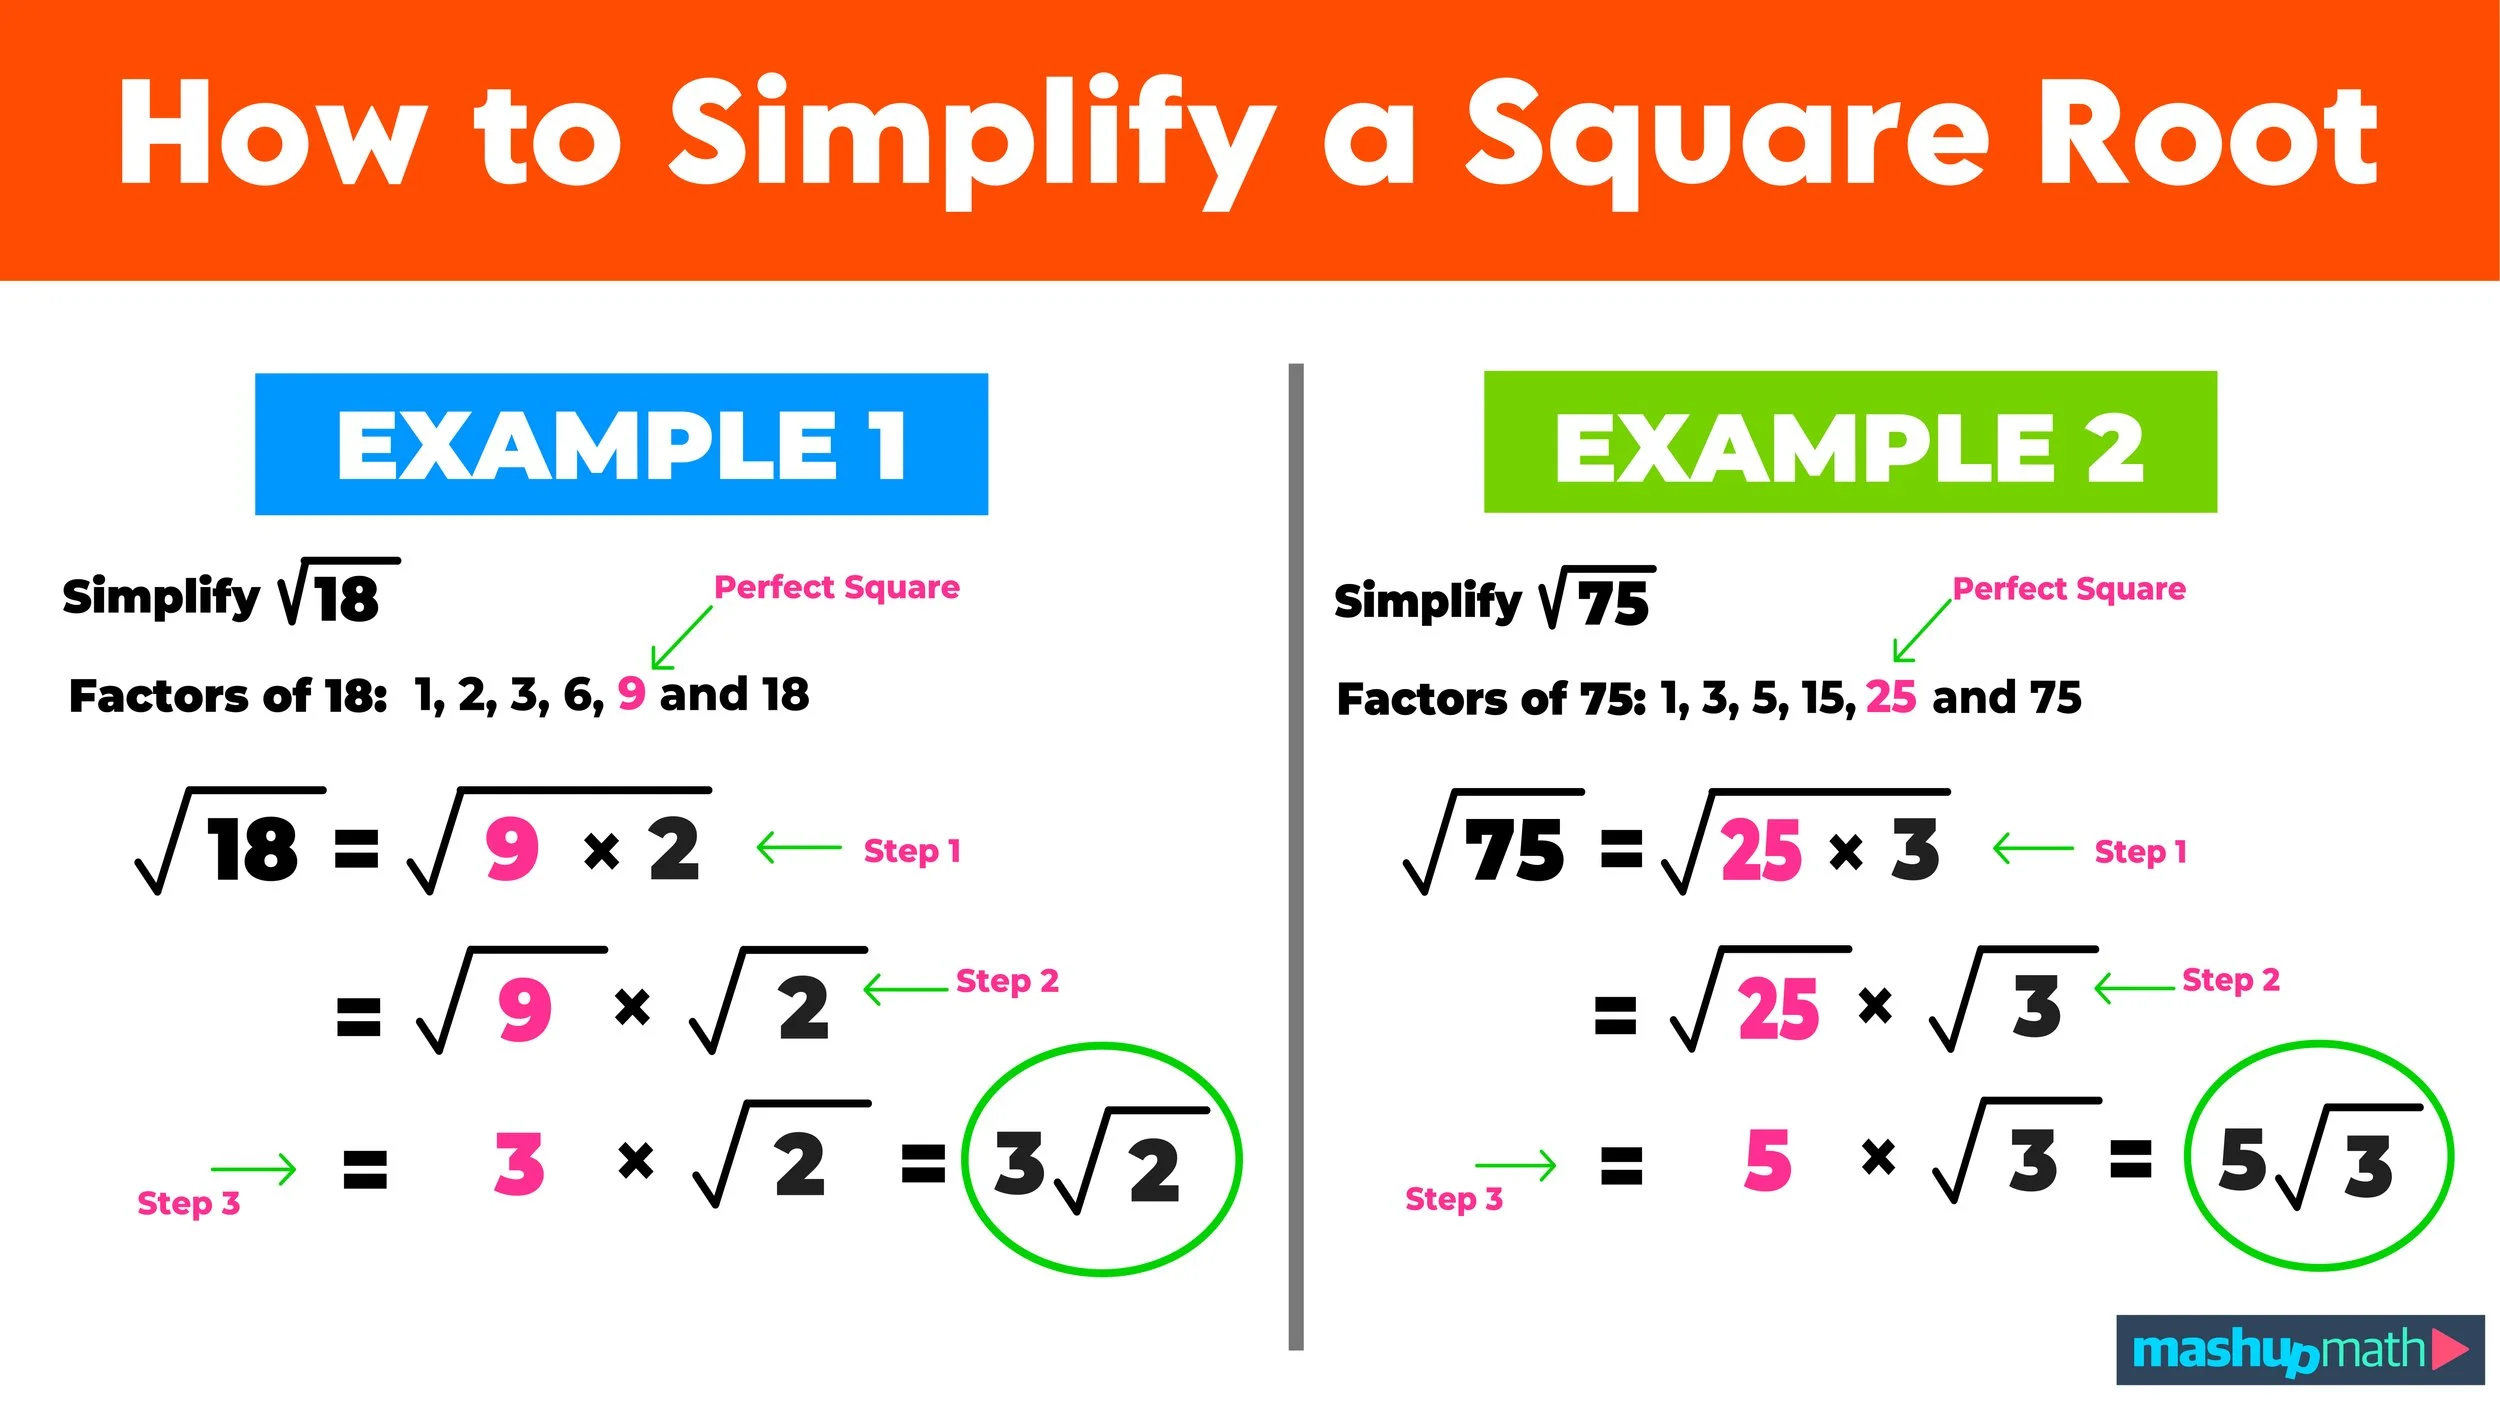
Example A: Simplify √18


Example A: Simplify √18

In our first example, we want to simplify a square root of a non-perfect square: √18.

We can simplify a square root like √18 by using our three step strategy as follows:

Step 1: Identify two factors where one of them is a perfect square.

Let’s start by listing the factors of 18:

  • Factors of 18: 1, 2, 3, 6, 9 and 18

Notice that 18 has one factor that is a perfect square: 9, and that:

  • 9 x 2 = 18

Since 9 x 2 equals 18, the two numbers that we are going to use for Step 2 are 9 and 2.

Step 2: Split the product using two square root symbols.

For the second step, we can use the factors from Step 1 to rewrite √18 as follows:

  • √18 = √(9 x 2) = √9 x √2

We can “split” the square root in this way because of the product property of square roots, which says that:

  • √(A x B) = √(A) x √(B)

(provided that A and B are non-negative numbers).

So we now have a new equivalent product that represents √18, which is…

  • √9 x √2

Step 3: Simplify the perfect square and rewrite your final answer.

For our final step, notice that one of the square roots in our new expression, √9, is a perfect square. Since we know that √9 = 3, we can rewrite √9 as 3 as follows:

  • √9 x √2 = 3 x √2

Now, all that we have to do is rewrite the result, 3 x √2, as 3√2 , and we have solved the problem!

Final Answer: √18 = 3√2

Figure 02 below shows the step-by-step process for simplifying this square root.


Figure 02: How to Simplify a Square Root in 3 Steps.


Now that you have learned how to simplify a square root, let’s gain some more experience by working through another example.


Example B: Simplify √75


Example B: Simplify √75

We can solve this next example by using the three steps that we used to solve the previous example.

Step 1: Identify the factors of 75 and determine the largest perfect square factor.

We can begin by listing the factors of 75:

  • Factors of 75: 1, 3, 5, 15, 25 and 75

Notice that 75 has one perfect square factor, 25, and that:

  • 25 x 3 = 75

Step 2: Split the product using two square root symbols.

Next, we can use the factors from Step 1 to rewrite √75as follows:

  • √75 = √(25 x 3) = √25 x √3

Step 3: Simplify and solve.

Finally, we can simplify √25 as 5 (since √25=5) and rewrite the expression as follows:

  • √25 x √3 = 5 x √3

We can now rewrite 5 x √3 as 5√3 and we can conclude that:

Final Answer: √75 = 5√3

The entire process for solving this problem is shown in Figure 03 below.


Figure 03: Multiplying fractions with whole numbers Example B solved.


Example C: Simplify √112


Example C: Simplify √112

For our final step-by-step example of how to simplify a square root, let’s take on a triple-digit number using our three-step method.

Step 1: Identify the factors of 112 and pick out the largest perfect square factor.

  • Factors of 112: 1, 2, 4, 7, 8, 14, 16, 28, 56 and 112

Notice 112 has two perfect square factors: 4 and 16. In cases like this, always choose the largest perfect square factor (16 in this case).

Now that we have identified our perfect square factor, we can say that:

  • w16 x 7 = 112

Step 2: Split the product using two square root symbols.

Next, we can write √112 as follows:

  • √112 = √(16 x 7) = √16 x √7

Step 3: Simplify and solve.

For the final step, we can simplify √16 as 4 and rewrite the expression as follows:

  • √16 x √7 = 4 x √7

Now we just have to rewrite 4 x √7 as 4√7 and we have solved the problem!

Final Answer: √112 = 4√7

The three-step process for solving Example C is shown in Figure 03 below


Figure 03: How to Simplify a Square Root in 3 Steps.


More Free Math Resources: